Track your ROI in Google Analytics and stop wasting money on marketing channels that don’t move the needle.
Measuring your ROI is the definite way to prove whether your marketing efforts are working.
But ROI tracking isn’t straightforward, especially if you have several channels working together to drive new business.
Our data backs it up. 31% of marketers stated that proving ROI was one of their biggest challenges. And it’s no surprise.
Marketers working in lead generation businesses struggle to connect their efforts to revenue simply due to complications with linking data from a website visitor, to a lead, to a sale.
While tracking ROI isn’t always simple, knowing the revenue impact of your marketing campaigns will help you make smarter use of your budget and resources ahead.
So, in this article, we want to tackle the topic of ROI tracking head-on and show how to do it the right way. And what better place to measure your ROI than Google Analytics?
What you’ll learn:
💡 Pro Tip
Marketing attribution is the best way to track leads and determine which marketing sources contribute the most revenue. Ruler attributes revenue data from your CRM to your marketing channels, landing pages, ads and keywords, allowing you to calculate your ROI more accurately.
How Ruler attributes revenue to your marketing
Chances are you know what ROI is and how to calculate it. But for the sake of clarity, let’s quickly define what we mean by ROI in marketing.
Related: Marketing ROI definition and how to calculate it
If you’re a marketer and want to understand the value of your campaigns, tracking ROI is the best way to go.
ROI, which stands for return on investment, is the process of attributing profit and revenue to the impact of your marketing.
The formula for ROI is as follows:

For example, if you invested £1,000 into your campaign and made a sale of £2,000, your gain is £1,000. That means your ROI is 100%.
Proving ROI is a priority, especially for marketers who are seen as a cost centre.
Related: How to definitively prove your marketing ROI
Without tracking ROI, there’s no way of knowing marketing efforts are worth it (or not worth it).
There are many ways to track ROI, but the easiest way is to set up conversion values in Google Analytics.
A conversion value is a monetary number assigned to the completion of a goal or event in Google Analytics.
Any conversion can be assigned a value. It’s just not limited to eCommerce transactions.
Related: How to calculate and assign a value in Google Analytics
With conversion values, you can quantify the monetary impact of each conversion and better estimate your ROI.
Tracking ROI in Google Analytics using conversion values includes the following steps:
Important Note: Google is sunsetting Universal Analytics (UA) in 2023 and replacing it with Google Analytics 4. For this demonstration, we will be using GA4 to track conversion and ROI. If you’re still using Universal Analytics, don’t worry. We do have historical blog posts to help guide you through the process. We’ll include these wherever relevant.
First, you need to configure your conversion tracking in Google Analytics.
You can’t track conversion value without tracking the conversion, right?
Important Note: For Universal Analytics, follow the steps in this guide on setting up Google Analytics conversion tracking.
If you’ve recently switched to GA4, you will have noticed that Goals are no longer a viable option to track conversions in Analytics.
Previously, Google Analytics Goals were used to track actions that could affect your business. For example, leads and sales.
Now Google Analytics just has events.
If you click “configure” and select “events” in GA4, you’ll be able to see all the predefined options set by Google Analytics, including:
In order to track a lead or sale in GA4, you need to create a custom event and turn it into a conversion.
There are two ways to set up a custom conversion in Google Analytics.
In this demonstration, we will stick with the first option. But you can go to our guide on Google Analytics conversion tracking and learn how to configure a new tag in Google Tag Manager to capture and report a unique event in GA4.
For now, here are the steps for creating a new conversion event based on an existing option.
Let’s say you have a SaaS product and offer a free demo of your best features.
Users fill out a form to book a demo and are redirected to a thank you page after they hit submit.
You could take the predefined event page_view and trigger a conversion whenever a user lands on your thank you page. Here’s how to do it:
1. Log into your GA4 property, go to Configure > Events > Create Event.
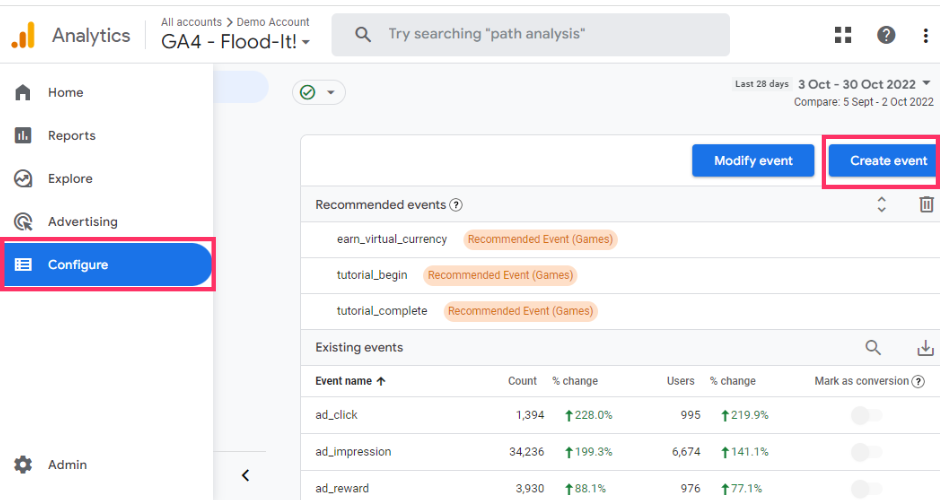
2. Give your custom event a name and set up your condition settings. In the example below, the configuration will trigger a new conversion event whenever someone views a thank you page after submitting a form.
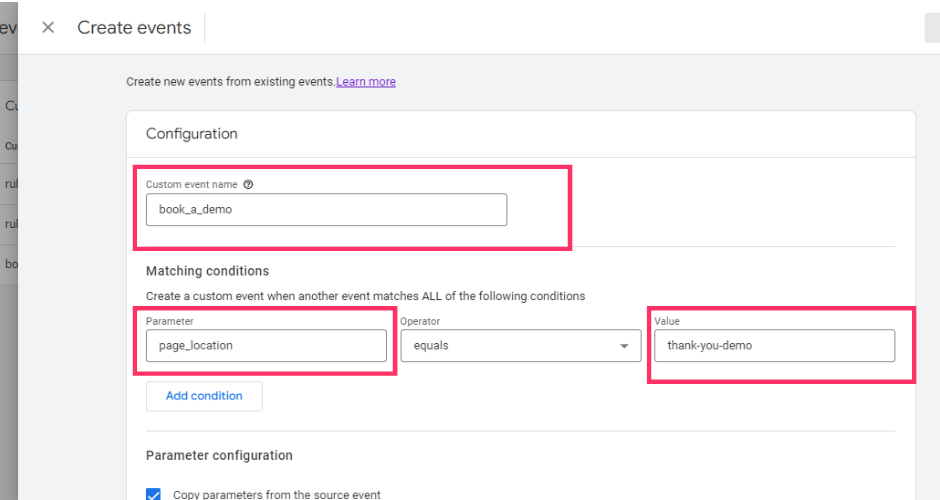
3. Once you’ve set up your custom event, click Create.
4. Now go to Conversions. You should see your custom event listed below. All you do is mark it as a conversion using the slider, and you’re good to go. Don’t panic if you don’t see your custom event. Sometimes it can take a while for it to appear. Close the window and come back at a later time to see if it’s there.
Now you’re ready to add a conversion value. But if you run paid ads, you’ll first want to import cost data into Google Analytics.
Adding cost data into Google Analytics allows you to analyse the performance of your online ad campaigns alongside your conversion data to gain a better view of your ROI and ROAS.
To pull in data from other advertising platforms, you’ll need to set up data importing in GA4, and you can achieve this by following the steps below.
Important Note: For Universal Analytics, follow the steps in this guide on adding cost data in Google Analytics.
1. Log into your Google Analytics account, click on Admin and go to Data Import.
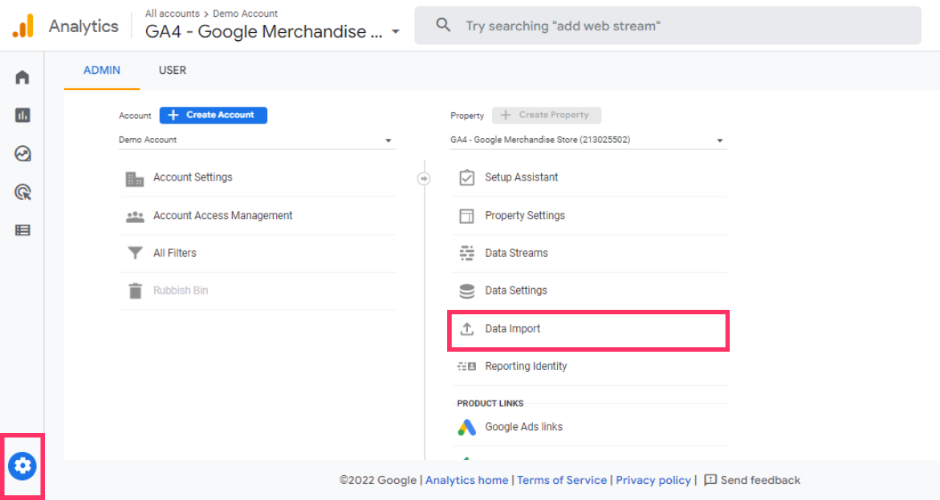
2. Click on Create data source.
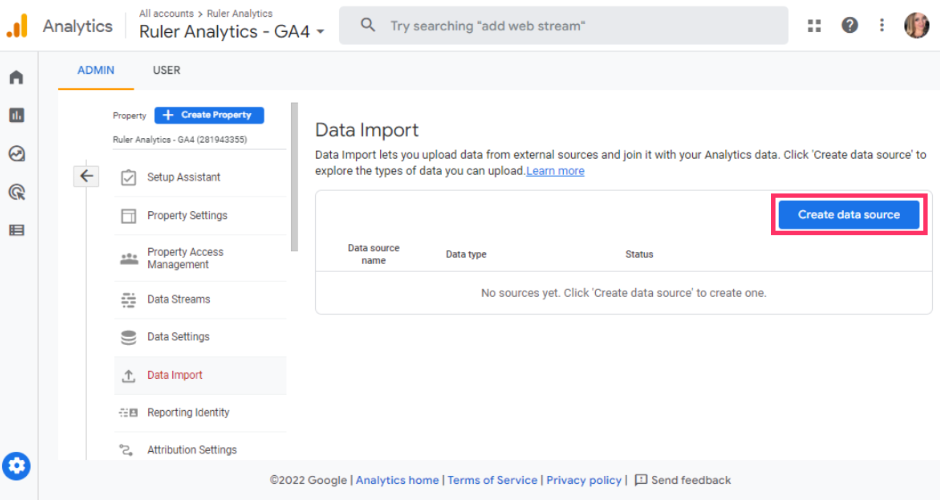
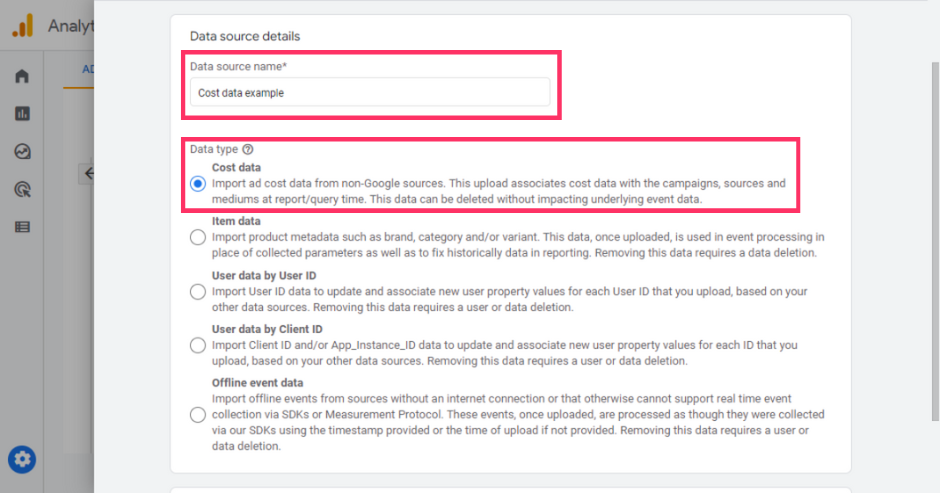
3. Name your data source. You’ll also see various data types to import extra information based on products, User ID and Client ID. For this example, we’re going to choose Cost Data.
4. Now, it’s time to set up your data schema. You’ll need to provide some information in your .csv about your ad campaigns so that Google Analytics can accurately match up the data in your reports. This data includes the date, medium, and source. Google Analytics has a template that you can use to format your cost data.
5. Once you’ve formatted your cost data, upload your data for import using the Upload CSV option and click Next.
6. Next, you’ll need to map the data in your CSV file with each corresponding field in Google Analytics. Select each field that you want to import into Google Analytics.
7. Once you’ve mapped your data, you’re ready to upload your cost data. Click on Import in the top right corner to get started. This may take a few minutes, depending on the size of your CSV file.
8. When the upload is complete, you’ll see a green tick under Status.
Please be aware that your cost data can take up to 24 hours for Analytics to make that data available in reports, audiences, and explorations.
Conversion values are important because, without them, it can be difficult to estimate the value of your ROI.
Take the example below.
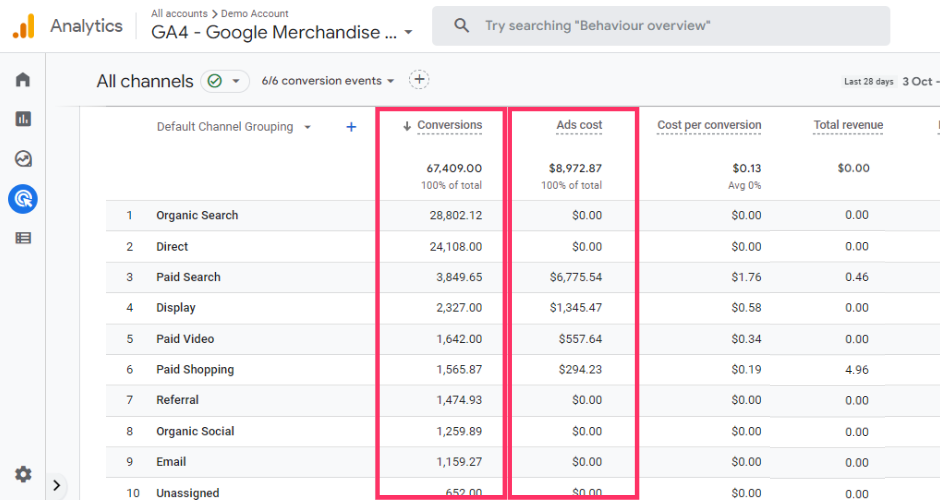
Here we have our cost data and the total number of conversions generated from our paid advertising efforts. From this data, all we can track is cost per conversion. But we all know that cost per conversion (or lead) isn’t the most reliable metric to measure marketing performance.
Related: Cost per lead: Is your marketing effective?
Now let’s add conversion value data.
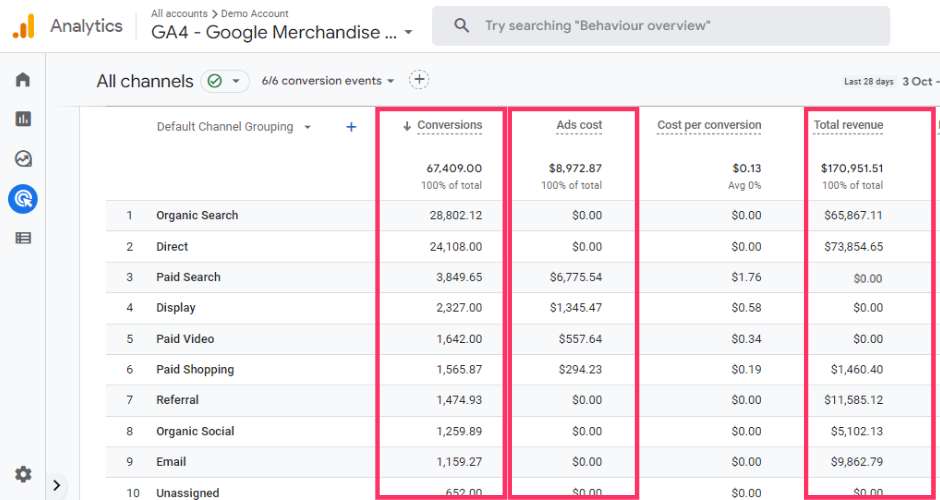
Instead of relying on cost per conversion, we can now track metrics like ROI and ROAS to determine how our investments impact overall revenue.
Related: How to track ROAS in Google Analytics
If you created the conversion using a predefined GA4 event, then you can simply adjust the configuration to include a value. Here’s how:
1. Navigate to Configure and Create event.
2. You should see the event that you created earlier. Select this event.
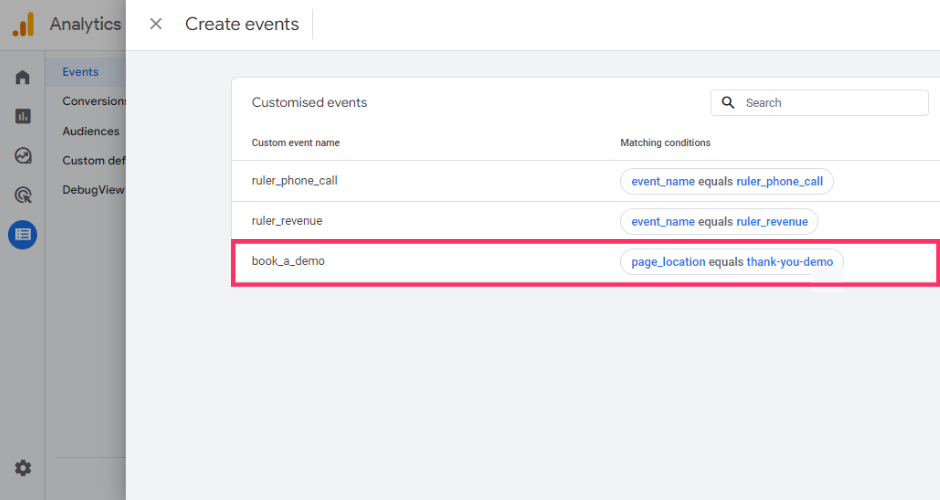
3. Click on the Pencil icon in the top right-hand corner to add a value. Scroll down and click on Add modification.
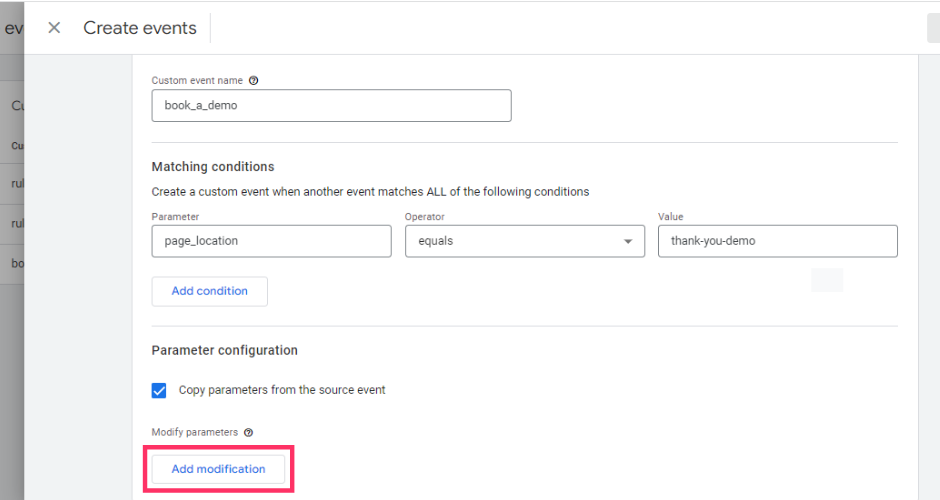
4. Here you need to add two parameters to the event “currency” and “value”. In the first parameter, add in currency and include in your currency code (GBP). Click on Add modification again. For the second parameter, add in “value” and include the value amount for your event. For this example, we’ve chosen £50. This will mean each conversion event will be assigned a value of £50 whenever it’s triggered.
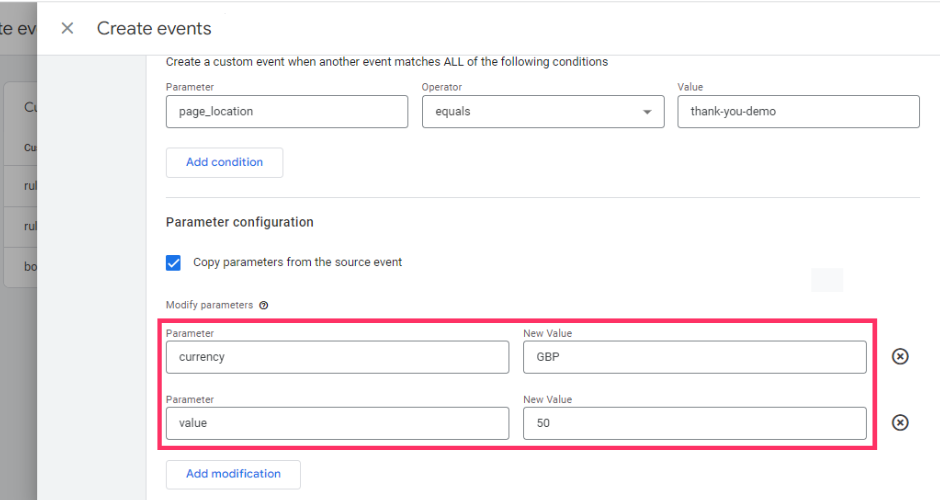
5. Click Save.
At this point, you’re probably wondering how to calculate your conversion values.
Assigning values is much easier for businesses that accept payments online.
For example, let’s say you use digital marketing to promote an offline event but take payments online. People can go onto your website, book and pay for their ticket, and you can use the total cost to assign this as a value in Google Analytics.
Easy, right?
If you’re tracking conversions for a service-based website, calculating your values is slightly tricker but achievable.
As a workaround, you can apply an estimated figure to your conversion events.
Let’s say you generate ten leads via a contact form on your website.
Out of all these leads, you manage to convert one into a £1,000 sale. You divide the total of £1,000 by the ten leads to give you an estimated value of £100.
You’re not receiving £100 for each person, but you know that you have a 10% close rate. So, you can assign £100 value for each lead coming through your contact form.
This method isn’t a reliable way to measure the value of your goals, but it can provide you with some clues on where your revenue is coming from.
If you’ve successfully followed the steps above, you should be all set to track your ROI.
You can use the cost and value data in Google Analytics to see which advertising efforts offer the highest return and optimise your marketing for maximum revenue.
Google Analytics is the industry standard for measuring marketing performance. Our data backs it up. 91% of marketers say Google Analytics is their go-to choice for reporting.
While Google Analytics is a powerful tool to help you better understand your website performance, it falls short when it comes to tracking pipeline and revenue generation.
Conversion values aren’t dynamic in Google Analytics.
Let’s say you add £50 to the value. Every time somebody completes a conversion, Google Analytics will assign that amount.
You can’t change it.
This is fine if you sell a single product with one set price. However, if you provide a service or bespoke products, you’re going to struggle to track your ROI.
B2B businesses, in particular, mostly rely on leads to feed their sales pipeline.
But not every lead is created equal. Different marketing sources generate different revenue and lifetime values.
Plus, not every lead is an ideal fit for your company. Some leads may convert, and others may fall out of the funnel.
It’s somewhat unfair to group and assign individual leads the same value, as each person is embarking on their own journey towards becoming a customer.
Google Analytics works wonders in measuring the results of your digital activities but falls short of tracking offline conversions.
Out of the box, Google Analytics can’t currently tie offline conversions to your digital marketing touchpoints.
Google Analytics was built to show how users find your website and convert online using digital methods such as form fills.
But form fills aren’t the only way for users to communicate with your company. Despite the rise of modern technology, many people prefer to pick up the phone and ask questions about your products and services.
This makes phone calls a valuable lead generation tool for marketers.
Our data backs it up. 50% of marketers rely on phone calls to drive quality leads.
But with a lack of offline conversion data and detailed user journeys available in Google Analytics, marketers are missing out on a great deal of data about their inbound phone leads and where they’re coming from.
Google Analytics has made some changes to the lookback window.
The attribution window determines how far back in time Google Analytics will consider a conversion for attribution credit.
For acquisition conversion events, the maximum attribution window is 30-days (only applicable to first_open and first_visit events). For other events, you can choose up to 90 days.
The average lead-to-close length for B2B companies is 102 days.
If you’re relying on Google Analytics, chances are you’re missing out on multiple marketing data points that played a key role in getting leads and revenue.
💡 Pro Tip
Follow Katie on LinkedIn for tips and tactics on attribution, analytics and all things digital marketing. Don’t forget to say hi.
Taking the limitations into consideration, it’s clear that Google Analytics is not the most reliable tool to track your ROI.
Related: The limitations of Google Analytics
Google Analytics doesn’t provide the right data to calculate your ROI. Conversion values help, but they’re not accurate enough to show what marketing efforts are working to drive the most revenue.
A better option is to use a revenue attribution tool. Tools like Ruler Analytics, for example, allow you to enrich your Google Analytics with CRM revenue data to understand which marketing sources generate the highest ROI.
Let’s take a closer look at how Ruler works and how it sends revenue attribution data to your Google Analytics.
The fundamental issue with Google Analytics is that it can’t track the identity of individual users.
Data is anonymised in Google Analytics, with users being assigned random ID numbers. So, when a user converts on the website, you can’t see their email, name or contact information.
Related: How to track individual users in Google Analytics
With its inability to track individual users, the link between your marketing and revenue is effectively broken. If you can’t see where leads convert, you can’t attribute revenue accurately back to your marketing.
Ruler, on the other hand, can track individual users. It does this by isolating activity down to each specific user.
Related: How to track full customer journeys with Ruler
Let’s quickly look at the difference between Google Analytics and Ruler. First up, we have a screenshot of a visitor’s journey in Google Analytics.
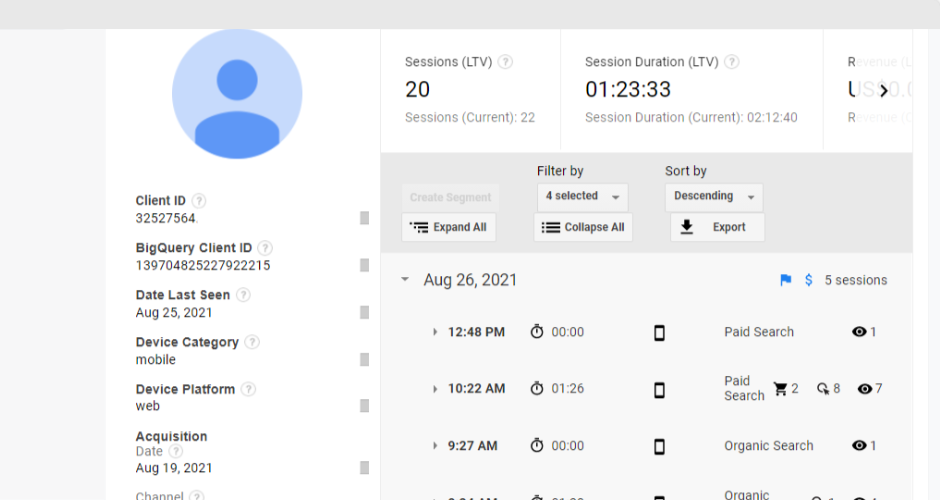
We can see how many sessions this user had, what device they used, and the last date they were seen, but that’s it. We don’t know who this user is or how far they made it down the funnel.
Now, let’s take a look at Ruler.
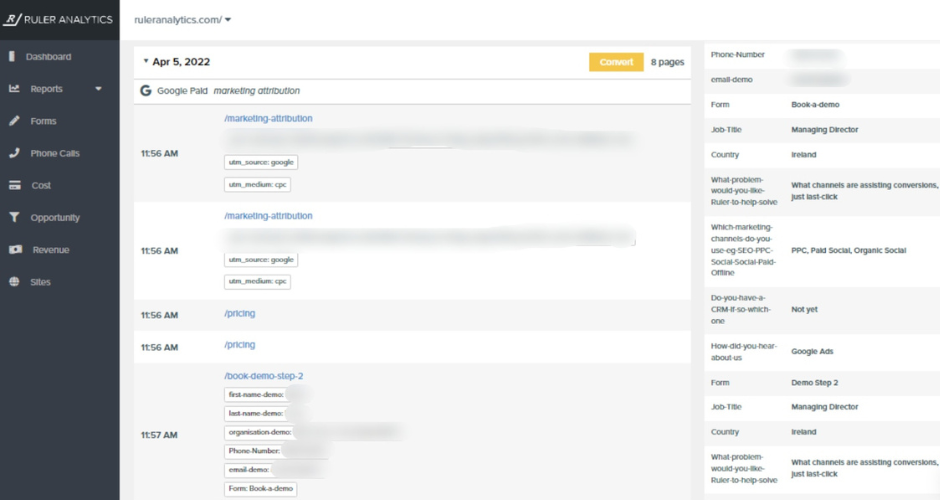
In the example above, we can see that a user clicked on one of our marketing attribution ads and converted into a lead using a form. More importantly, we can see the user’s contact details and other marketing datapoints.
By having complete access to this data, we have a unified view of our leads and their journeys. We can see what campaigns drive real leads for our business, allowing us to optimise accordingly.
With Ruler, we can see where leads came from and what pages they visited. That means the link between marketing and revenue is restored.
To connect our marketing efforts and revenue, we send Ruler’s attribution data to the CRM.
Take the example below.
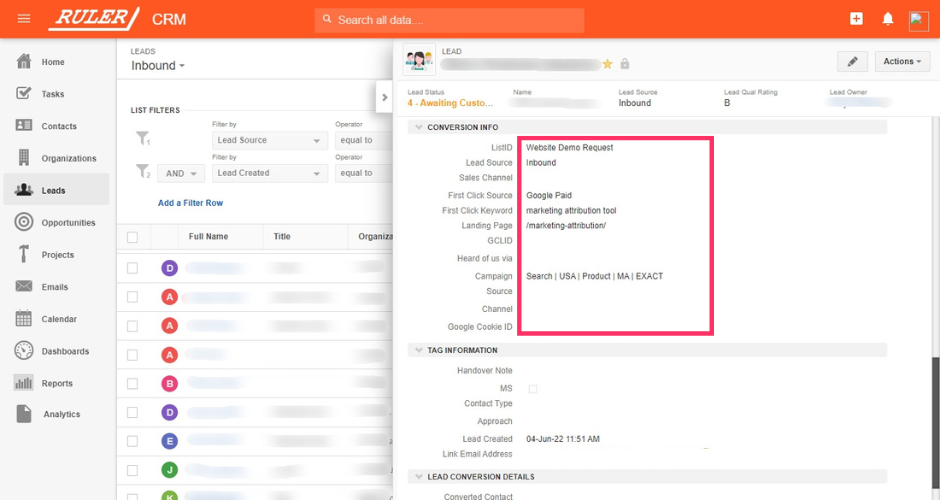
Here, we can see the lead that converted on our marketing attribution product page. This lead has sat a demo and moved onto the opportunity stage. All we need is the lead to sign on the dotted line, and we can close it as won.
This is crucial because, without this data, we wouldn’t be able to demonstrate our impact on the pipeline.
But with Ruler’s attribution data in the CRM, we can see how leads find our business, how long it takes them to convert, and where they’re getting lost in the funnel.
At each stage of the funnel, leads will begin to fall through the cracks and lose touch. Some leads, however, will go on to become paying customers.
And this is when the magic starts to happen. When a lead converts, Ruler will utilise a pre-built integration to fire conversion and revenue data to its dashboard.
Related: How Ruler attributes revenue to your marketing
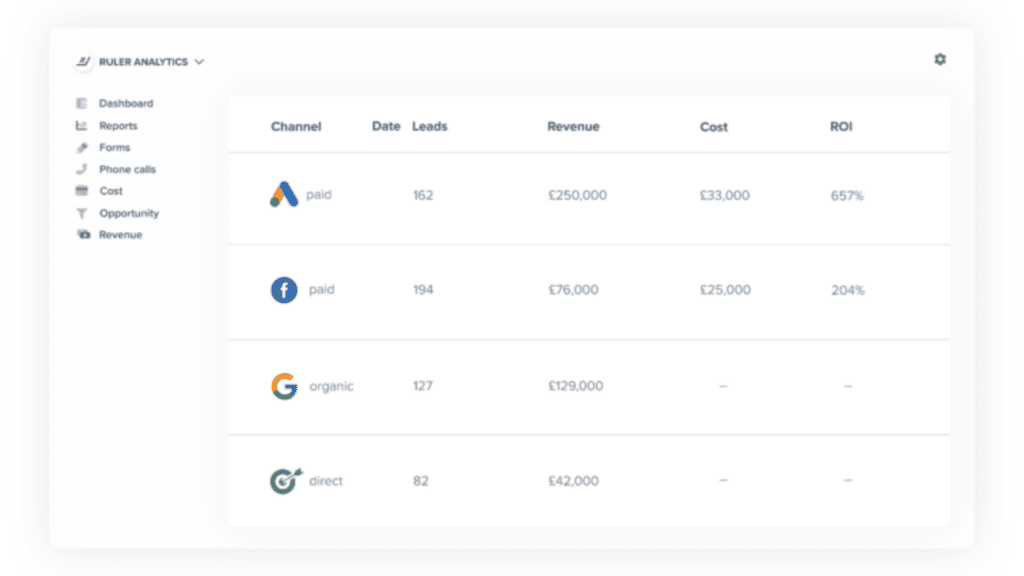
After Ruler has assigned the revenue to the correct touchpoints, the data is passed onto Google Analytics.
Related: How Ruler enriches Google Analytics with attribution data
By adding revenue data to Google Analytics, we can go beyond conversion values and see exactly how our marketing impacts revenue and ROI.
Ruler also tracks your phone call leads. So, you can measure your offline conversion data and revenue against all your traditional metrics directly in Google Analytics.
Take the example below.
In this acquisition report, we can see that LinkedIn and Facebook have contributed a similar number of leads. Let’s say we had an additional budget to spend. Based on the conversion data in Google Analytics, we’d likely invest it into both channels.
Now let’s add revenue data from Ruler.
Despite generating the same number of leads, LinkedIn clearly had a better impact on revenue. Instead of splitting the budget between both channels, we can focus our efforts on LinkedIn. We can even drill down by campaign and ad to gain maximum revenue.
ROI is a critical metric for marketers. If you’re not tracking ROI, you won’t know if your marketing efforts are making you money.
And revenue is the ultimate goal, right?
Google Analytics is a good place to start for ROI tracking, but as you’ve seen, it’s not the most reliable method.
While it’s a must-have tool for marketers, Google Analytics does have its flaws. Google Analytics can’t track leads and attribute revenue back to specific marketing data points. Without revenue data, it’s hard to see what makes a good return on investment.
But with tools like Ruler, you can. Ruler makes the process of tracking ROI easy.
It tracks your data on a visitor level, allowing you to successfully attribute leads and marketing-generated revenue across multiple campaigns, ads, keywords and more.
See it for yourself. Book a demo of Ruler and see how it can help you track your marketing ROI. Or learn how Ruler helped Totalmobile increase ROAS by 23% with revenue attribution.
