Learn how to prove your impact and optimise your results on pay-per-click by tracking ROAS with Google Analytics 4
Your paid campaigns are only as good as you optimise them.
Chances are, you feel immense pressure as a paid marketer to continue to drive value from your PPC campaigns.
And it’s no surprise.
There’s more ad saturation than ever before and customer journeys are getting more and more complex.
What does that result in?
A reduced view of the impact of your campaigns and their effect on the bottom line.
Tracking the return on ad spend of your paid campaigns in Google Analytics 4 is vital to see a channel-by-channel comparison.
You can see how your paid channels match up to each other and to other organic channels, plus how channels work together to drive revenue.
In this blog, we’ll run you through:
Let’s get started.
ROAS, or return on ad spend is the metric used to track the impact of your paid advertising on your bottom line.
Related: Complete guide to return on ad spend and how to track it
Similar to return on investment, return on ad spend looks specifically at how much revenue you generate compared to how much you spend on paid channels.
It’s calculated simply by dividing the revenue from your ads by the cost invested, which you then multiple by 100.
Related: Use our ROAS calculator
Ok, so we know what the metric means, but what is ROAS in Google Analytics?
You can calculate ROAS within Google Analytics once you’ve integrated your Google Ad accounts to your Google Analytics account.
Remember the ROAS metric in GA is only available within the Google Ads report.
Note: As of October 2022, we have included information for both Universal Analytics and Google Analytics 4.
In Universal Analytics, ROAS is a metric you can view under the Google Ads section.
It’s calculated via the following formula:
(ga:transactionRevenue + ga:goalValueAll) / ga:adCost
Related: How to measure the impact of your paid ads
Google Analytics 4 is a whole other beast.
In GA4, you don’t have access to the Cost Analysis report or the Google Ads report.
Instead, you just have one overall advertising report.
This is similar to the Cost Analysis report in the sense that you can upload cost data and that it amalgamates your paid media channel stats in one central hub.
To view it, head to Advertising, and then select All channels under Performance.
Here, you can view all of your paid marketing channels by the following metrics:
Remember, this data will be applied automatically to the data-driven attribution model built by Google Analytics.
You can change this by heading to Admin and under Property selecting Attribution Settings.
Here, you’ll be able to choose your preferred attribution model type.
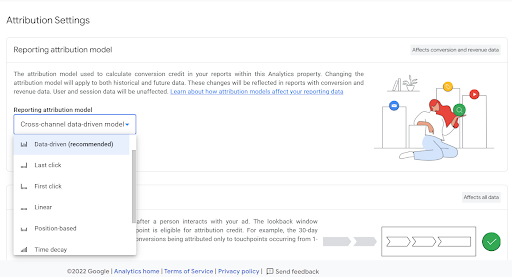
Google advises data-driven but make sure you choose whatever model type suits you best. You can change this model as you like as it will apply to both historical and future data.
You have two options when it comes to Universal Analytics.
It has a designated Google Ads report where you can view ROAS applied to your campaigns.
You can also use the cost analysis report to look at your paid non-Google marketing channels.
So, let’s break it down in two halves.
If you have already linked your Ad and Analytics accounts and you have tracking set up, then you will be able to view the ROAS metric.
To see it, head to Acquisition, then Google Ads.
Click Campaigns and then select the Clicks report.
ROAS is available to view in the rightmost column.
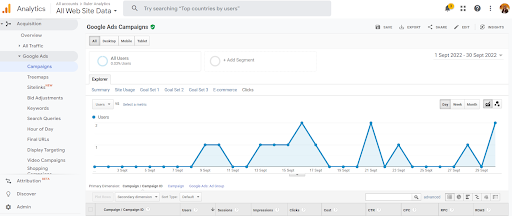
In this view, you can analyse the impact of all of your Google Ad campaigns by looking at metrics like:
The benefit of this, of course, is being able to apply Google Analytics variables as a secondary dimension to better compare your impact.
In order to view the ROAS of campaigns not run by Google Ads, you need to head to your Cost Analysis report.
The Cost Analysis report shows metrics for ‘google/cpc’ as well as any other channel that you upload cost data for.
Related: How to import cost data into Google Analytics
So while it takes a little effort to get all of this data in the right place, it means you have one central hub to view the impact of all of your paid media campaigns.
You can find your Cost Analysis report by heading to Acqusition and then Campaigns.
From there, select Cost Analysis.
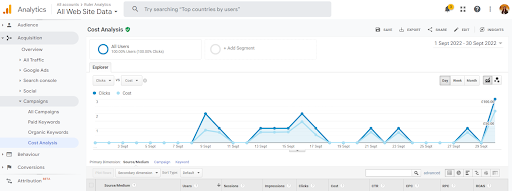
This view will give you an overall view of those same metrics but by all channels.
Remember, you could even add in costs like:
This will give you one holistic view of your inbound and outbound revenue. Of course, this is highly valuable for a marketer as you can quickly identify opportunities and risks.
But there are limitations.
With this report, you’re frozen into one attribution type.
This means you can’t look at how your cost and click data vary based on first, last, linear or data-driven attribution.
💡Pro Tip
Not sure how attribution is relevant? Read our complete guide to marketing attribution to better understand how it works and its role in marketing.
On the topic of attribution, it’s worth going into further detail.
Google Analytics 4 is offering more capabilities for marketers to apply attribution data to their marketing numbers.
But remember, Google Analytics is not a marketing attribution tool.
This is where we come in.
Ruler is a marketing attribution tool serving clients with reliable lead and revenue data for all of their marketing channels. We’ll get into how we can help you with attribution shortly. But first, it’s worth remembering that Google Analytics can go part of the way to help you better attribute your marketing impact, but it has its limitations.
Related: Limitations of Google Analytics
As far as attribution is concerned, these limitations can be whittled down to:
Let’s break these down into a bit more detail.
Google Analytics 4 only offers short options for lookback windows.
For acquisition conversion events you can either choose:
How often do you make a purchasing decision in a month? Particularly for high-value items or in the B2B space.
This limitation means you’re likely going to be unable to attribute closed sales back to your marketing activities.
For other conversion events you can choose between:
But these aren’t for acquisition-based conversions. They’re likely to be used for lead conversions, which although useful is still not ideal for accurate reporting.
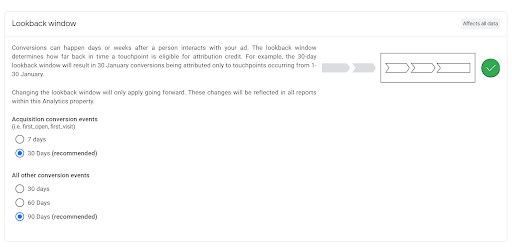
Note: Remember that for both of these lookback windows it will only affect future data, so be sure to set it as soon as possible.
Again, Google Analytics 4 is making moves to better track customer journeys. But they are notoriously difficult to track.
Related: The easy way to view customer journeys
GA has strict privacy policies to adhere to meaning it can be hard for its users to get any clear indication of individual customer journeys.
While GA4 does offer the conversion path report, this still buckets users and averages metrics. It will tell you a total revenue plus average touchpoints and time to close.
While this is helpful information, it is still top-level meaning you can’t get much in the way of deeper insight on your marketing efforts.
Google anticipates a lot of data being unattributable too.
Pro Tip
Not sure where to take your paid strategy? Check out how you can improve your ROAS with Ruler for all the tips and tricks to optimise your paid campaigns.
If you’re overwhelmed by the amount of data you have from app to app, and you’re looking for a simple solution to track, evidence and optimise your marketing then you’re in luck.
Ruler is the leading attribution tool supporting marketers to aggregate data and provide visitor-level insights to help revolutionise their marketing strategy.
How Ruler works is simple.
A user visits your website for the first time.
With Ruler’s tracking code on your website, Ruler can pull key marketing information about this user and store it under their personal cookie data.
As that user revisits your website, Ruler will continue to merge data held to create a digital journey.
Let’s say that this user decides to convert and fills in a form on your site.
At this point all of that data Ruler is holding will be fired over to your CRM for your sales team to check in on.
When your sales team closes that lead into a customer, Ruler will then scrape the revenue data held against that person in your CRM and fire it to your marketing analytics tools.
There, it will be automatically attributed to the influencing channels and campaigns.
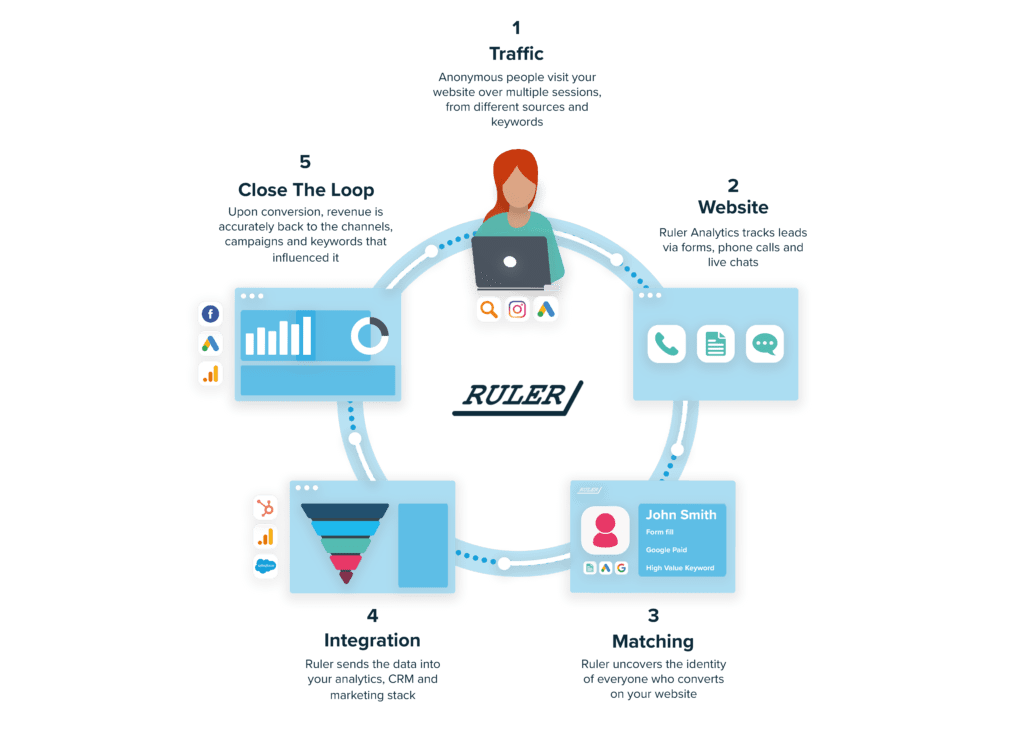
This seamless integration pushes and pulls the data you already have in your apps to where you need it most.
It means you can bypass the endless data integration and upload and let Ruler do all the hard work for you.
Plus, one quick login to Ruler will give you access to reports like this one.
A central dashboard to view your channels, campaigns, ads and even keywords by key metrics like:
So if you’re looking for an easier way to integrate your marketing data into Google Analytics 4, look no further.
Book a demo of Ruler to see it in action, or read more about everything you can discover in the app.