Use revenue attribution to prove your ROI, optimise campaigns, and allocate budgets with more confidence.
Revenue attribution has become a buzz term in marketing in recent years, with an increasing number of discussions around the topic.
This can only be a good thing, as marketers are being held increasingly accountable for the need to connect efforts with more than simple lead generation.
Instead, the attribution of revenue is paramount in a modern marketing strategy, with around 57% of marketing teams having some form of attribution tracking in place.
Whether you’re new to revenue attribution or would like a refresher on how to use it, this blog will cover the basics and help you get the most out of it.
For this article, we’ll discuss:
💡 Pro Tip
Ruler makes the process of revenue attribution so much easier. With its closed loop reporting, it can easily connect revenue data with your marketing campaigns, allowing you to fully demonstrate your impact on the bottom line.
How Ruler attributes revenue to your marketing
Revenue attribution, or marketing attribution, is a method which connects different data sets to determine exactly which forms of marketing are resulting in revenue.
Marketing technology continues to innovate, mature, and advance with each passing year.
As it does, there is an increasing demand for business executives to hold their marketing functions accountable where revenue is concerned.
Marketing attribution ensures this is possible, and that there is a clear line between marketing efforts and revenue income.
Conversion tracking provides a simple means of tracking the specific actions taken by people on a website.
The most frequent use of conversion tracking is in form submissions, such as a subscription to an email list.
However, conversions can also be used to track other actions taken on a page, such as clicking a button, following a link, or the amount of time spent on a page.
An action or goal is set, and when that criteria is met, it counts as a conversion.
Revenue attribution is a little different, as it tracks the specific marketing actions taking place, and the impact they have further down the marketing funnel.
Ultimately, the point at which they generate revenue, and how much they create.
Let’s use an example to illustrate the power of revenue attribution.
Below are two Google Ad campaigns.
| Name | Cost | Conversions |
| Campaign 1 | £1000 | 50 |
| Campaign 2 | £1000 | 10 |
Focusing on conversions only campaign 1 is the obvious top performer. For the same cost, it drove four times more conversions than campaign 2.
However, that result changes when we add revenue data to the picture.
| Name | Cost | Conversions | Revenue |
| Campaign 1 | £1000 | 50 | £5000 |
| Campaign 2 | £1000 | 15 | £10,000 |
By adding revenue data, we can now see that although campaign 1 drove the most conversions, campaign 3 generated the most revenue.
Revenue attribution essentially paints an entirely different picture of your campaign performance—one that can be used to make more informed decisions.
Instead, attribution keeps tabs on every engagement your leads make
It follows the customer journey stages from the first time they visit your website, to the point at which they purchase a product or service.
Related: Guide to customer journey stages and how to track them
A proportionate amount of revenue is attributed to every marketing effort leading to those engagements, based on the marketing cause behind each prospect engagement.
💡 Pro Tip
Tracking the customer journey allows you to understand which lead generation activity generates the most revenue and build campaigns that will result in definite success. Learn everything you need to know about tracking customer journeys and drive better results for your business.
Download the guide to tracking customer touchpoints
There are many revenue attribution models you can use for portioning credit, and they generally fall under the following categories:
As it says on the tin, single-touch attribution models allocate 100% revenue credit to a single touchpoint or channel. These attribution models generally assign conversion values to either the first or last touchpoint a visitor interacted with before making a conversion. Let’s take a closer look:
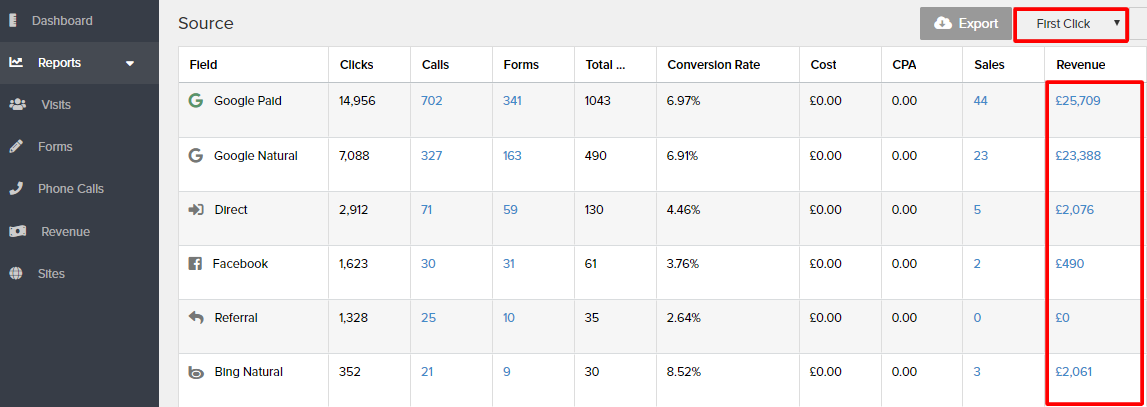
When first-touch attribution is used, all credit for revenue is assigned to the point of engagement from a lead.

For example, if they downloaded a free resource, like a cheat sheet, that would count as the first point of engagement, and revenue would be attributed to that point.
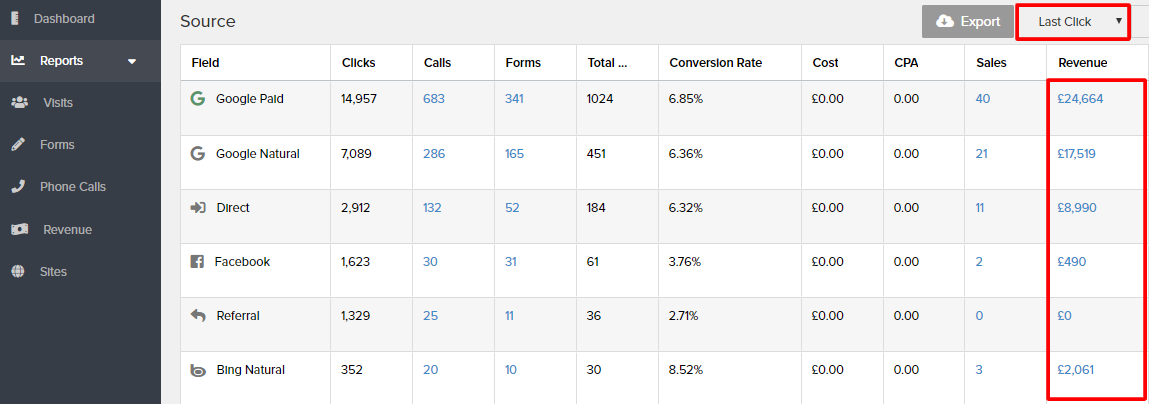
Last-touch attribution does the opposite to first-touch, attributing credit to the final point of engagement before revenue is generated.

The problem with this method is that it fails to account for earlier interactions, such as social media views or website visits and consequently means you miss core insights into your other marketing channels.
This model essentially works the same as last-touch attribution, except direct traffic is ignored, and 100% of the credit is assigned to the last channel that the visitor engaged with before making a conversion.
Given that both first and last single point attribution models only allow for one channel to be considered, and modern digital marketing has a plethora of channels, the single-source method is widely viewed as inaccurate and somewhat archaic.
This brings us to multi-touch attribution models. As the name suggests, multi-touch attribution (or MTA) models assign credit to multiple channels that contribute to the final conversion.
Related: Marketer’s complete guide to multi-touch attribution
Depending on which attribution model you choose, you can ensure key parts of your customer journey are accounted for and better understand the touchpoints occurring. Multi-attribution models include:
Linear attribution. Revenue from the conversion is distributed evenly across all of the touchpoints in the buyer’s journey.
Time decay attribution. Credit is distributed to all marketing touchpoints. But more credit is assigned to the most recent touchpoints, and is generally used for longer sales cycles, such as B2B.
U-shaped attribution. This model assigns credit to the first point of engagement, the creation of the lead, and everything in between. Credit is attributed by giving 40% to the first touch, 40% to the lead creation, and dividing the remaining 20% between the remaining touchpoints in between.
W-shaped attribution. Very similar to the U-shaped model, but with the inclusion of an additional point of contact – the creation of the opportunity. All three of the main touchpoints receive 30% of the credit, while the remaining points share the last 10%.
Full path attribution. This model offers an extension of W-shaped attribution by factoring in the final point of closure. While most of the credit is applied to the key milestones along the client journey, the touchpoints between are given a lower weight of credit. This model comes with the big benefit of accounting for the follow-up interactions carried out post-opportunity by your sales team and assigning them an equal weight of credit to early marketing activities.
Custom attribution. Finally, there is custom attribution, which gives you the chance to assign credit according to your own custom model. This is arguably more sophisticated than other models, as it enables your team to determine their own weighting percentages, using the specific marketing channels, industry, and typical client behaviour relevant to your business.
Unlike the rule-based attribution models we’ve just discussed, data-driven attribution uses machine learning technology to create a custom model for each business.
Related: Marketer’s guide to data-driven attribution
It analyses customer behaviour to identify patterns among those users who convert compared to those who don’t.
This is the big question all marketers are asking.
Generally speaking, how successful an attribution model is will depend largely on the business to which it’s applied.
With tools like Ruler (and the ability to use trial and error), you can test and compare different models to find the one that will work best for your company.
Regardless of which touchpoint in the journey you assign the most credit to, consider that it is going to be continually supported and budgeted for, in order to maintain high performance.
This can cause upstream channels to suffer due to the (often inaccurate) perception that they aren’t effective.
Multi-channel methods of attribution enable you to see value over all your channels, which can ensure budgets are allocated more fairly.
As a marketer, you should always be proving why your work matters to your company, and using revenue attribution is the perfect way to achieve just that.
But where do you start?
We’ve left steps below to help you get the wheels turning.
First things first, you need to reevaluate your goals.
For a long time, conversions or leads have been the standard measure of marketing success.
In fact, 78% of marketers track their volume of leads to assess and determine marketing effectiveness.
But, as we’ve already highlighted earlier on, focusing on lead metrics only can have a devastating impact on your growth.
Revenue is the lifeblood of almost any business.
Before you get started with revenue attribution, you must shift your focus away from lead conversion metrics and ensure your team is working toward the same end goal: increased revenue.
Once you’ve set your goals, it’s time to set up revenue attribution.
Tracking visitors individually is usually the best place to start.
This method allows you to monitor and measure the movements of specific users more closely, from awareness to close.
Tools like Google Analytics 4 use first-party data and consider individual users who interact with your business.
To track individual users in Google Analytics, you will need to implement a User_ID that consists of a set of alphanumeric characters.
The only issue is that this data is anonymised.
So, you never really know who is landing on your website and converting to revenue.
A better option is to invest in a good customer journey analytics tool.
Access to customer journey tracking will allow your sales and marketing people to map every touchpoint of a specific user across multiple channels and sessions.
They can gain a better view of which ads and landing pages a user looked at leading up to their all-important conversion.
For example, Ruler tracks each anonymous visitor over multiple sessions, traffic sources and keywords.
Once an anonymous visitor converts into a lead, Ruler matches the user’s details to their marketing touchpoints to create a customer journey.
We have a blog on how to view full customer journeys in Ruler that tells you everything you need to know.
You’ll need a place to store all the marketing source data you’ve captured on your leads.
The best (and most common) place to store your marketing and conversion data is a CRM.
By storing your data in one place, you can ensure your teams can gain access to the same data and have a holistic view of the customer journey.
As leads move down the funnel, you’ll be able to determine the effectiveness of your campaigns at every stage of your sales pipeline.
For example, you may find a PPC campaign is driving plentiful leads, but has a poor lead to opportunity rate.
Obviously, manually adding marketing source and conversion data to your CRM can be complicated and time-consuming.
But, with tools like Ruler, the job couldn’t be easier.
Ruler integrates with almost any tool, allowing you to seamlessly pass marketing source and conversion data to your CRM without the legwork.
Once a lead converts into a deal, it’s time to attribute it back to the original source.
If you were to use a tool like Ruler, you’d be able to automatically match revenue back to the marketing channel, campaign, keyword and more.
Here, your marketing team would be able to build reports showing exact values for marketing-generated revenue.
It doesn’t stop there.
Ruler allows you to report and view revenue data in the tools you use every day.
At Ruler, for example, we use our platform and ChartMogul to track and report on monthly and annual recurring revenue driven by our marketing activities.
Related: How Ruler uses ChartMogul to close the loop between marketing and revenue
In ChartMogul, we’ve set up custom fields, and marketing source data is passed from our platform and CRM.
This integration allows us to track our monthly and annual recurring revenue segmented by lead source, allowing us to measure:
We have plenty more content on how revenue attributes revenue marketing if you’re interested to learn more.
Marketers are being held increasingly accountable for the need to connect their efforts with revenue growth.
Simple lead generation is not enough.
With revenue attribution, you can better measure your offline and online marketing campaigns and allocate budget towards acquiring higher qualified leads.
Ready to try out a revenue attribution solution?
Ruler can help to close the gap between your sales and marketing data so you can prove your ROI, optimise your campaigns, and budget, and see all your data where you need it most.
Learn more on how Ruler attributes revenue to your marketing.
Alternatively, book a demo of Ruler and see it in action for yourself.

This article was originally published on 31st October 2020 and was last updated on 12th May 2022 for freshness.