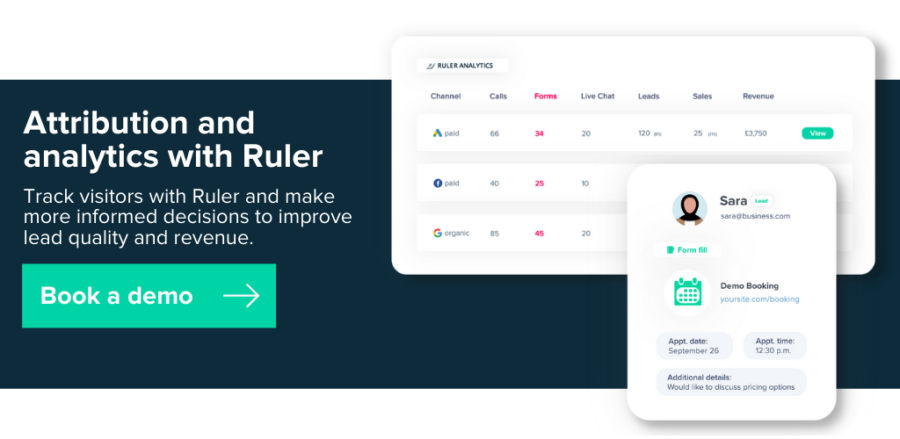
Enrich your Google Analytics reports with Ruler’s data and attribute revenue to your traffic sources using different attribution models.
Google Analytics is the most popular web analytics tool in the world.
In fact, 90% of marketers say Google Analytics is their go-to tool for measuring web and marketing performance.
One notable feature of Google Analytics is its attribution modelling and ability to credit different and multiple interactions for conversions.
And while Google’s attribution data gives you key data on how different marketing sources impact your traffic and conversions, you can unlock much more insight by integrating Ruler Analytics.
Keep reading to learn how Ruler supports Google Analytics, what features it includes and how it can give you a more accurate view of your marketing ROI.
In this article, we’ll discuss:
Let’s get started.
Attribution modelling in Google Analytics provides you with better visibility into your marketing performance.
Related: What is Google Attribution and how to get started
It’s a set of rules in Google Analytics and works by outlining specific touchpoints that lead to a click, conversion, or sale.
Attribution modelling allows you to take a holistic view of your marketing efforts and evaluates which keywords, ads and landing pages have the greatest influence on specific goals.
Without attribution modelling, measuring the effectiveness of your marketing on clicks, conversions, and sales would simply be out of the question.
Pro Tip
Are you new to marketing attribution or looking to grow your existing knowledge? Learn the basics of marketing attribution, models, and learn which ones work best for you in our easy to follow guide.
Complete guide to marketing attribution
Marketers have many attribution models to choose from. Google Analytics, however, offers seven default models that are already built into the platform.
First-touch attribution: All of the credit is attributed to the very first channel or campaign that the customer interacted with in a conversion path.
Last-touch attribution: Similar to first-click, instead, the final touchpoint gets 100% of the credit.
Last non-direct click: Works the same as last-touch attribution, except Direct traffic is ignored, and 100% of the credit is assigned to the last channel that the visitor engaged with before making a conversion.
Linear attribution: The credit for the conversion is divided equally across the customer journey.
Time decay: Each touchpoint receives credit. However, Analytics gives more weight to the interactions closest in time to the conversion.
Position-based attribution: 40% credit is allocated to the first and last click touchpoints, and the remaining 20% credit is distributed evenly across the other interactions.
Last Google Ads click: This model prioritises Google Ads. It assigns 100% of credit to the last Google Ads interaction in a conversion path.
Each of these attribution models will produce different findings and provide various outcomes. You can learn everything you need to know about the different types of attribution models and the best time to use them in our guide on attribution modelling.
Pro Tip
Google Analytics also offers data-driven attribution.
Unlike the rule-based attribution models we’ve just discussed, data-driven attribution uses machine learning technology to create a custom model for each business.
It analyses customer behaviour to identify patterns among those users who convert compared to those who don’t.
We have a complete guide to data-driven attribution if you want to learn more.
Marketer’s guide to data-driven attribution
Let’s take a look at the different methods for setting up and changing your attribution model in GA4 and Universal Analytics.
Important Note
Google Analytics announced at the end of 2021 that it’ll be ditching the default model last-click attribution in Google Analytics in favour of the data-driven model.
Updating your attribution model in Google Analytics 4 is really easy, all you need to do is follow these steps.
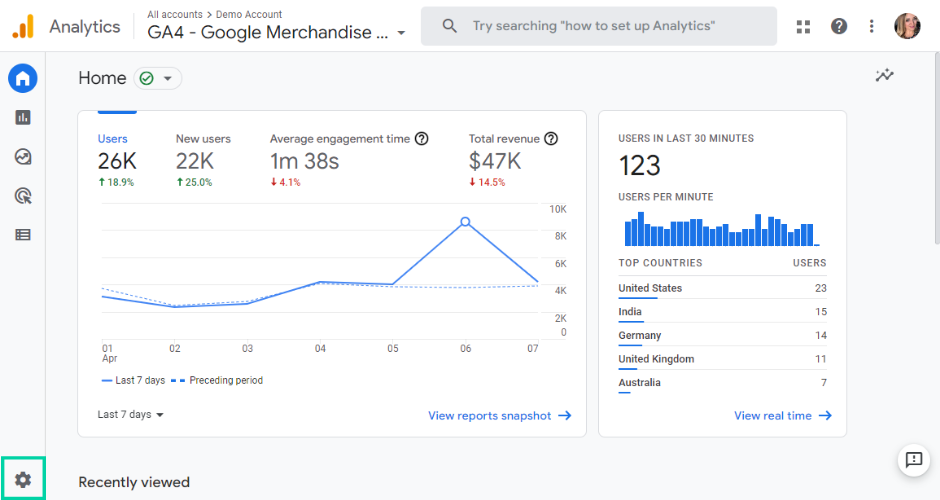
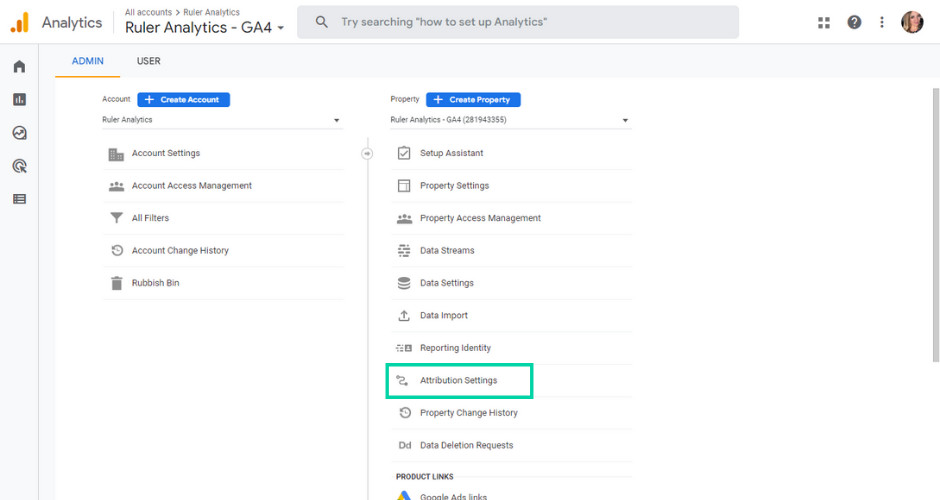
2. In the property column go to “Attribution Settings”. Here you’ll see all the different attribution models to choose from.
3. Under “Reporting attribution model”, select your desired option from the drop-down. Google Analytics 4, by default, will recommend the data driven attribution model.
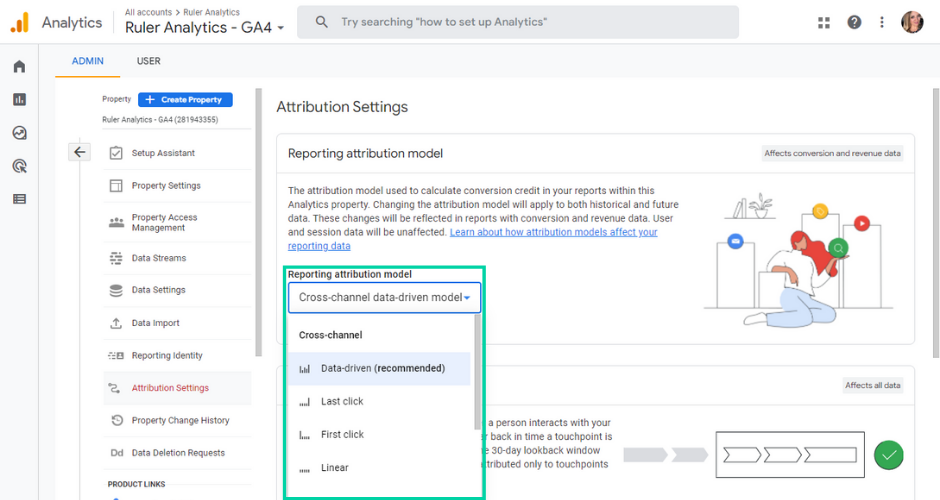
4. You’ll also have the option to adjust your lookback window. Once you’re happy with your selection, hit “Save”.
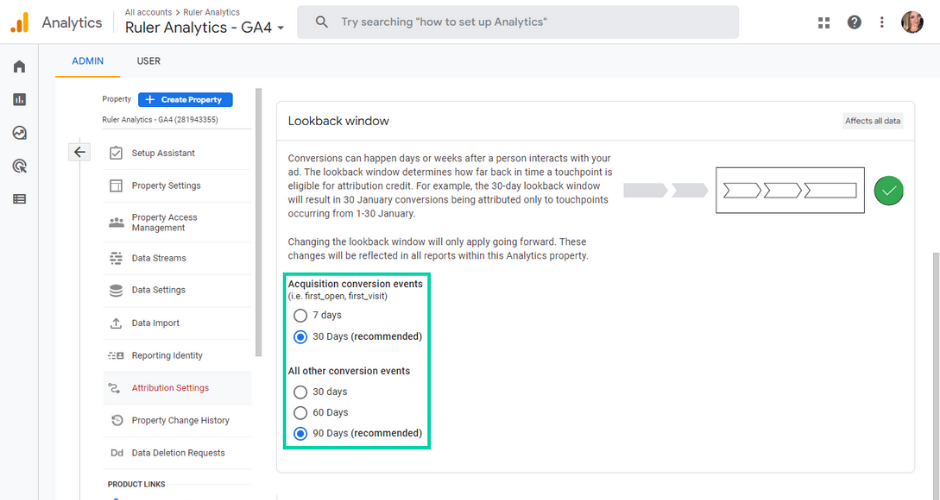
If set up correctly, attribution for conversion and revenue metrics across all reports in Google Analytics that use event and traffic source dimensions should change.
The great thing about GA4 is that you can change your attribution model as many times as you like to find one that works best for you.
Unlike GA4, you can’t change the default attribution model in Universal Analytics. You can, however, use the model comparison tool to compare your data using alternative attribution models. To compare attribution models in Universal Analytics, follow these steps:
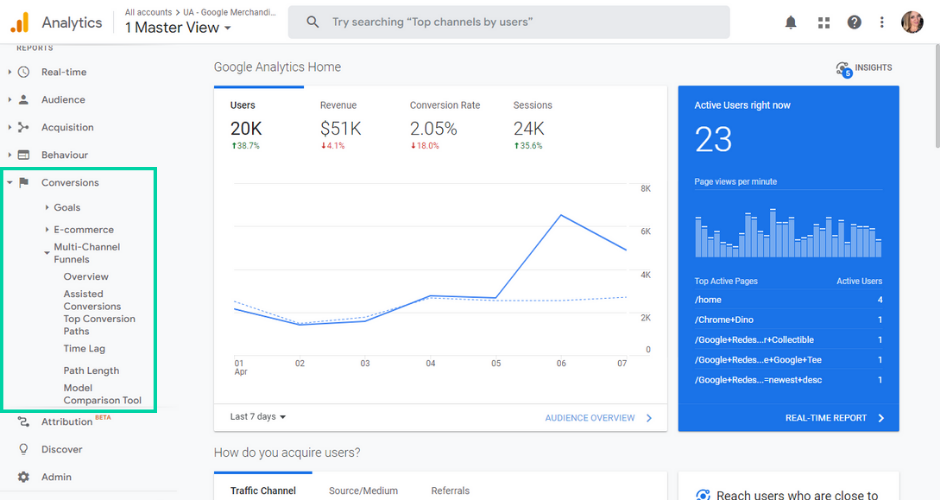
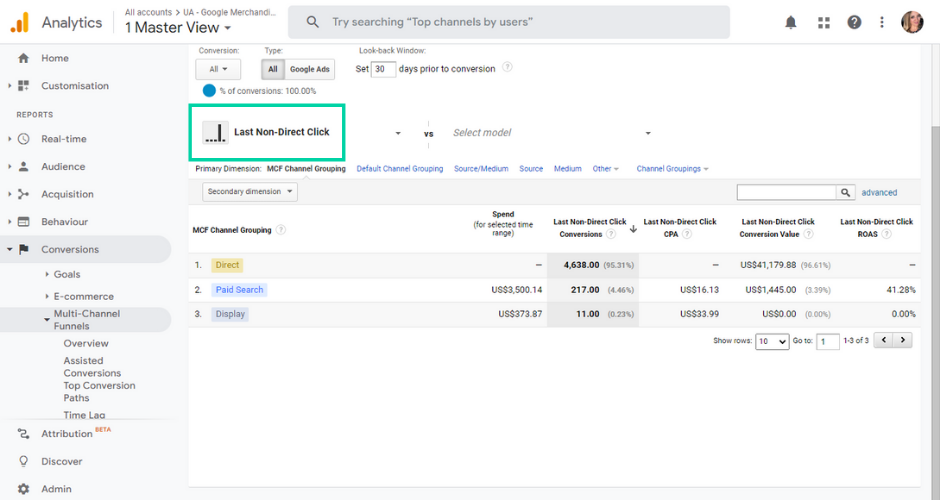
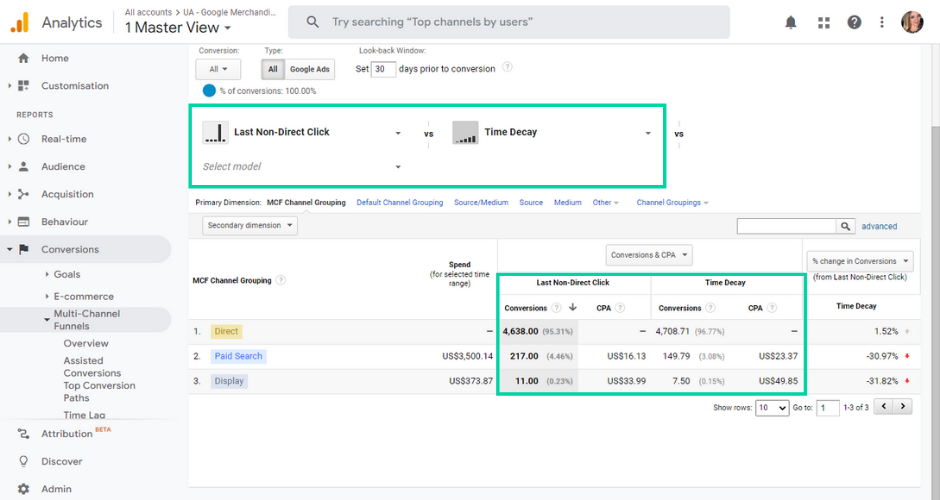
Google Analytics has made it possible for marketers to view their marketing efforts through the lens of each attribution model and assign value to any factor that may have contributed to a click or conversion. But, it isn’t perfect.
Google Analytics can only display a user ID for each device.
A Google Analytics user ID is a set of alphanumeric characters that are assigned to a device and allows you to identify users across the course of multiple sessions.
Related: How to track users in Google Analytics
Why is this a problem, you may ask?
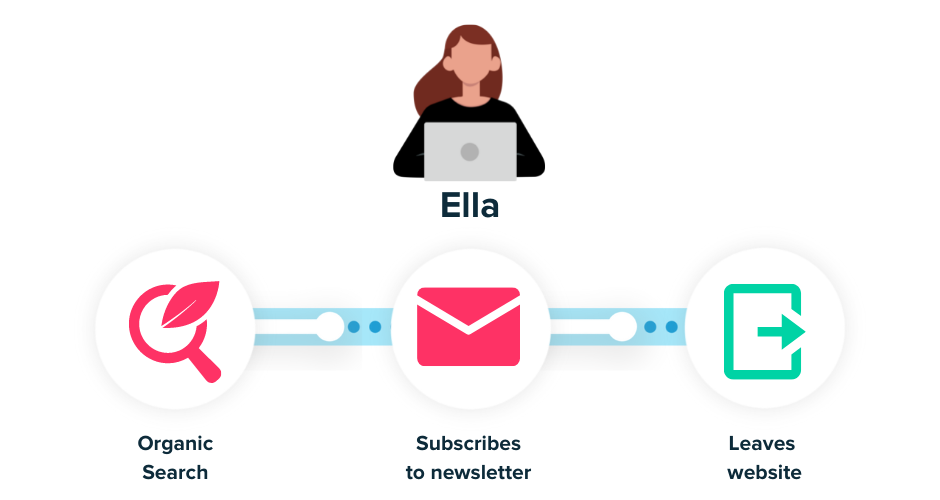
Let’s say Ella types in an organic search on her laptop and comes across your website.
Ella signs up for your newsletter, navigates through your website, interacts with some of your products and leaves.
A few days later, Ella clicks on a link in your email newsletter using her smartphone and completes a purchase on your website.
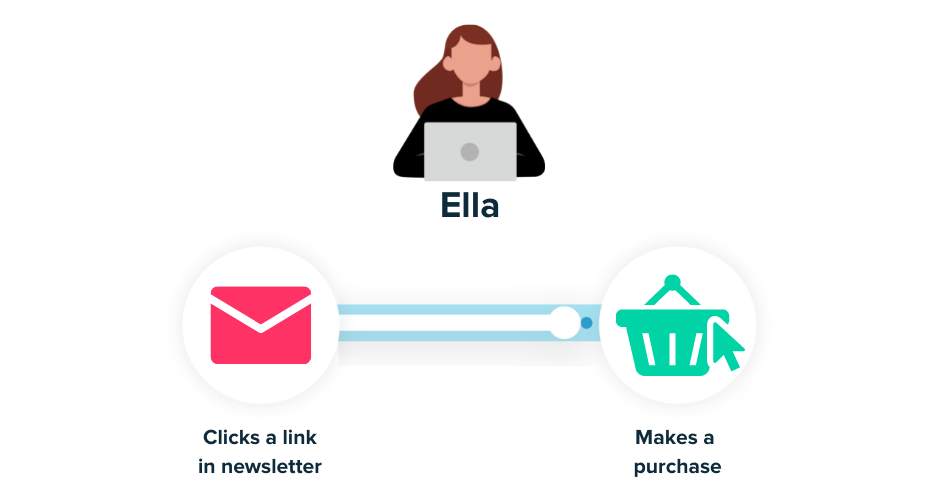
Ella used two different devices to convert into a lead.
While we know this is part of the same customer journey, Google will record this as two individuals.
If you’re selling a complex product or service, this can result in significant monetary damage.
Relying on data sourced on an individual device provides very little to no insight into what is and isn’t working.
Let’s go back to our example above.
In Ella’s customer journey, she initially found your website using an organic search.
Google Analytics, however, would ignore this interaction and assign all credit to email.
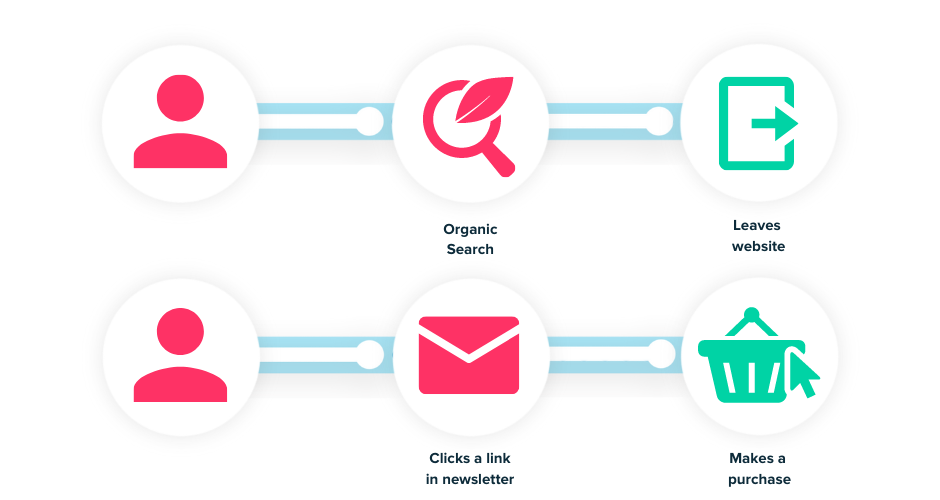
Depending on the data in Google Analytics, you may decide to put all your money and resources into your email marketing and neglect your SEO efforts.
But, if it wasn’t for the organic search, Ella would never have converted into a lead.
If you sell a high-value product or provide B2B services, it’s likely that there are multiple stakeholders involved in the sales process.
Once a visitor converts into a lead and hands negotiations to another stakeholder in the business, Google Analytics completely loses visibility over the conversion path.
On top of that, B2B customer journeys can often last months after the first touchpoint.
In fact, we found that 52% of companies endure sales cycles lasting between one to three months, while 19% have sales cycles greater than four months.
The longest attribution window Google Analytics offers is 90-days.
Basically, if your average sales cycle lasts longer than three months, there’s a chance you’re missing important data on your customer journeys.
Google Analytics works wonders for tracking the results of your digital activities, but out of the box, it doesn’t provide much insight into your offline conversions and inbound calls.
Related: How to track offline conversions in Google Analytics
The initial purpose of Google Analytics was to help users understand web and digital metrics rather than focus on traditional means of marketing.
But, despite the growth of modern technology, phone calls and offline interactions are still considered the most valuable type of lead for many businesses.
In fact, 50% of marketers rely on phone calls to drive quality leads.
With the lack of offline conversion data and detailed user journeys available in Google Analytics, B2B marketers are missing out on a great deal of data about their conversions and where they’re coming from.
Attribution modelling in Google Analytics on its own simply doesn’t give you the full picture you need to measure and optimise your marketing efforts.
Fortunately, Ruler is here to help.
Ruler’s marketing attribution solution helps marketers close the loop between sales revenue and marketing.
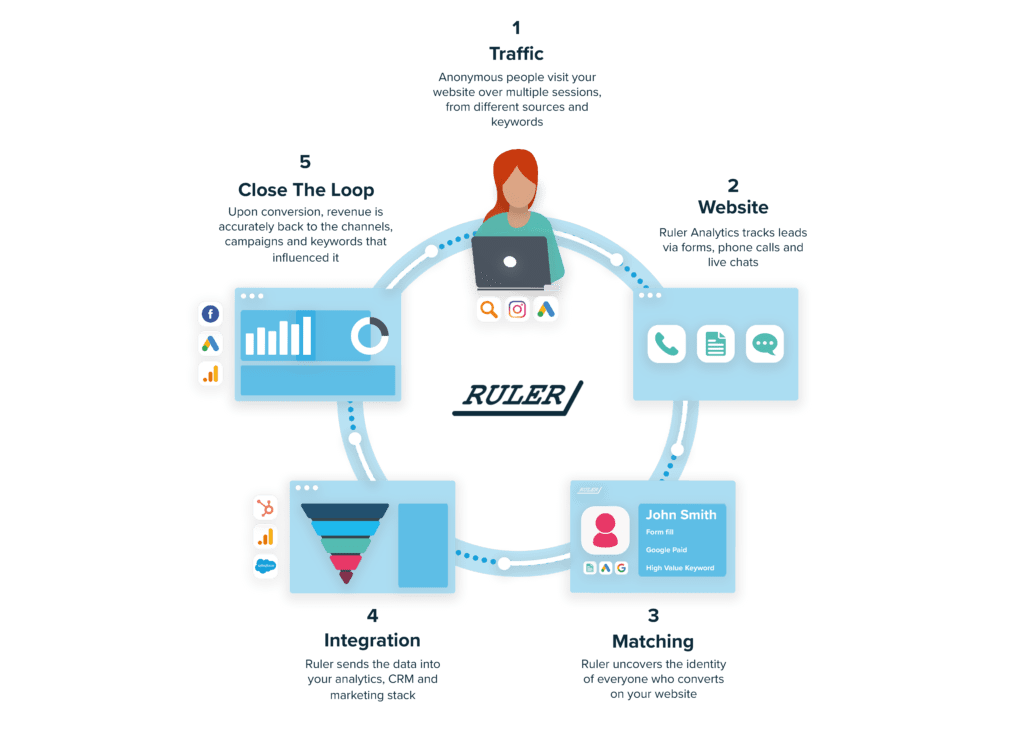
Let’s take a look at how it works.
1. Ruler tracks each anonymous visitor to the website over multiple sessions, traffic sources and keywords.
2. When a visitor converts into a lead, data is captured via form fill, phone call or live chat.
3. Ruler matches the user’s conversion details with their marketing touchpoints.
4. The marketing and conversion data is then sent to your CRM. Marketing source data includes channel, source, campaign, keyword and/or landing page.
5. Ruler’s attribution solution allows you to analyse the impact throughout the entire sales cycle. Once an opportunity is closed into revenue, Ruler sends this information back to it’s dashboard. The revenue data is attributed to your marketing touchpoints that played a key role in the conversion path.
Related: How Ruler attributes revenue to your marketing
6. It doesn’t stop there. Ruler passes this conversion and revenue data to your Google analytics and paid media tools. This allows you to switch between different attribution models and track exactly which marketing channels drive the most revenue.
The Ruler and Google Analytics integration is an extremely popular choice.
Our users are benefiting from more solid multi-touch reporting by matching leads and revenue to their most profitable online sources using different attribution models.
Using the comparison tool in Google Analytics and revenue data from Ruler, you can see how the data offered by each model affects your understanding of your marketing performance.
That’s not all.
Ruler integrates with your Google Analytics account by sending inbound calls and revenue to a goal you create in GA.
In other words, you can use your model comparison tool and determine which marketing channels, ads and keywords are most successful at generating leads and sales in the offline world.
Pro Tip
Follow the instructions in this guide and learn more on how to send revenue events from Ruler. Or, alternatively, book a demo of Ruler and see this in action for yourself.
Once you enrich your Google Analytics reports with Ruler’s attribution and revenue data, you can start to benefit from better insights to improve your marketing effectiveness and ROI.
Want to learn more about Ruler and how it can help benefit your Google Analytics? Read our blog on the benefits of integrating Ruler with Google Analytics.
Or book a demo of Ruler and speak with one of our marketing attribution specialists.
