Track your Facebook ROI and build better campaigns to increase your revenue.
When it comes to paid social, it’s so easy to get distracted by vanity metrics, such as clicks, comments and social shares.
In all honesty, these metrics can be useful in gauging what your audience thinks of your content and, to that extent, can inform the rest of your marketing.
But while increased traffic and engagement are all wonderful benefits, they don’t highlight how your ad campaigns drive business revenue.
What your CEO wants—more than clicks and engagement—is more revenue.
And rightly so. Revenue is the lifeblood of every business.
So what is the best way to track the impact of your ad campaigns on revenue?
By tracking your Facebook ROI, of course.
And, we’re going to help you get there.
For this article, we’ll discuss:
💡 Pro Tip
The launch of Apple’s iOS 14.5 update and Google’s third-party cookie phaseout has made traditional multi-touch attribution less effective. Here at Ruler, we’re on a journey to combine multi-touch attribution and marketing mix modeling (MMM) to create a more effective approach to marketing measurement.
Book a demo to learn more
Facebook ROI (Return on investment) is a metric you can use to evaluate the profitability of your Facebook ad campaigns.

Calculating your Facebook ROI is easy when you know how to do it. All you do is take the net investment gain and divide it by the cost of investment and multiply it by 100.
Being able to track your ROI is non-negotiable, especially for Facebook advertisers.
Related: How to definitively prove your marketing ROI
It’s the most effective way to prove which investments work for your marketing.
If you don’t know how to track Facebook ROI, you cannot determine what campaigns contribute the most revenue.
As a result, you run the risk of wasting your budget on campaigns that underperform, or worse, don’t deliver any value at all.
If you’ve been in the marketing game for some time, there’s a good chance you’ve heard of ROAS.
Related: What is ROAS? Understanding return on ad spend
On the surface, return on ad spend (ROAS) and return on investment (ROI) may look the same, but they are different.
ROI considers all the costs that go into building an ad campaign and puts it against your revenue.
ROAS doesn’t.
Instead, ROAS only considers the cost of advertising when looking at returns.

Differences aside, ROI and ROAS are equally important and should be utilised to track the success of your ad campaigns.
Tracking Facebook ROI is key for any successful business. It’s the most effective way to prove which investments work and which don’t. But tracking ROI is tricky for two main reasons.
Tracking Facebook ROI is challenging for several reasons, including limitations in tracking technology and user privacy concerns.
But, the release of iOS 14.5 created additional challenges for Facebook advertisers.
Apple’s iOS 14.5 includes a privacy feature called App Tracking Transparency (ATT), which requires apps to obtain user permission before tracking their data across apps or websites owned by other companies.
It’s believed that the ATT opt-in rate by iOS users worldwide is around 46%. That means advertisers are missing data on nearly half of Apple users.
This update has ultimately led to a decrease in the number of conversions and revenue within Facebook.
And as more people continue to opt out of tracking, the process of measuring the ad effectiveness and ROI will become increasingly challenging for advertisers.
The concept of “data walled gardens” also makes the process of tracking Facebook ROI difficult.
Data walled gardens are online platforms (e.g. Facebook) that keep user data within their own ecosystems and do not allow access to third-party advertisers.
When data is locked within a single platform, advertisers struggle to source the information they need to accurately measure their ad effectiveness.
For example, Facebook may not share information about how many people clicked on an ad and then went on to make a purchase on a different website.
This lack of transparency makes it difficult for advertisers to track their ROI and optimise their campaigns for maximum results.
That’s not all.
Walled gardens often have their own unique advertising metrics and reporting. This can make it challenging for advertisers to compare performance across different platforms and further complicates the process of tracking and comparing ROI.
By connecting your Facebook ads and leads to revenue, you can gain an objective view of performance and make better strategic decisions for your campaigns.
You’re not alone if you’re struggling to get past tracking lead volume.
We learned that 37% of marketers found generating high-quality leads to be one of their biggest challenges.
So how do you connect your Facebook ads to revenue?
There are different ways to track your Facebook ROI, but we’ll show you how we do it.
Using the tools below, we’re able to track leads from our Facebook ads and attribute revenue to understand which campaigns contribute the highest converting customers:
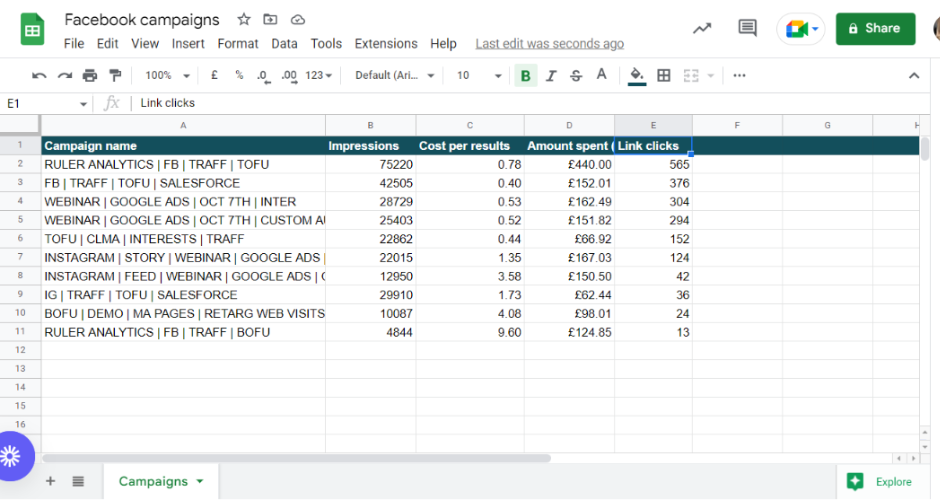
First, we export our ad performance data from Facebook to a Google Sheet.
This allows us to track traditional engagement metrics and compare them against our leads, opportunities and revenue data further down the line.
To do this, we head over to Facebook Ads Manager.
We open Facebook Ads Manager > select our time frame and the relevant metrics > click download > select CSV > export.
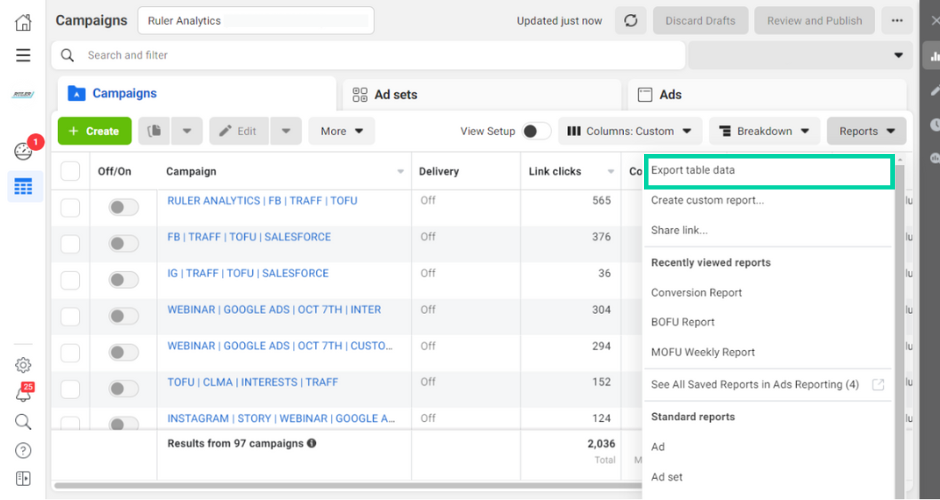
We remove data that isn’t useful to us to stay focused on the metrics that interested us most.
Note: The numbers in this example are fictitious and are only used here as an illustration.
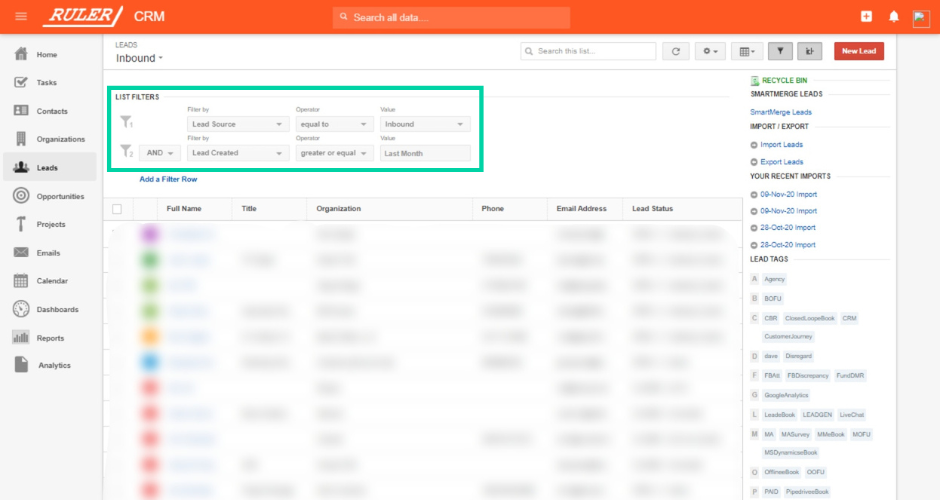
Now it’s time to export our leads and opportunities from our Insightly CRM.
This will allow us to compare our leads and opportunities against our engagement data and gain a better understanding of Facebook’s impact on downstream funnel metrics.
First, we head over to Leads > Filter leads by last month > export to excel.
Next, we navigate to “Opportunities” and repeat the same steps we used for leads.
Insightly and CRMs alike do a great job storing your leads and opportunities.
If you’re not using a CRM, you’re certainly missing out.
Related: What is the role of a CRM in marketing
However, there is one major flaw in today’s modern CRM systems. They don’t provide much information on your leads and the touchpoints they used to find your products and services.
Fortunately for us, we have the advantage of Ruler’s attribution.
Ruler is a marketing attribution tool that tracks each and every web visitor across multiple landing pages and marketing channels and can integrate with almost any CRM.
Related: How to track full customer journeys with Ruler
When a visitor converts into a lead, their contact details are matched with their marketing touchpoints over multiple sessions.
The conversion details and marketing data are then passed onto Insightly.
This allows us to see where our highest quality leads and new customers come from and track how our ad campaigns impact pipeline generation.
Take the example below.
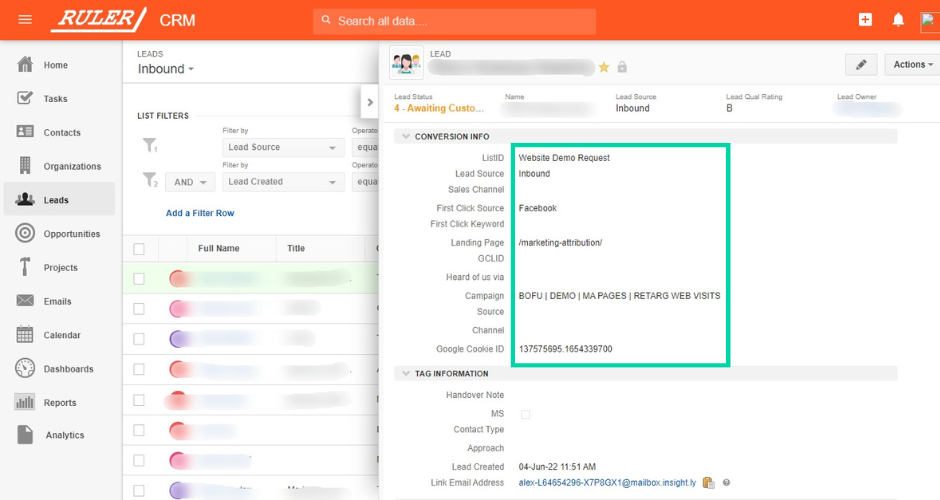
With Ruler’s attribution data, we can see that this lead converted after viewing a Facebook ad campaign and converted on our marketing attribution product page.
💡 Pro Tip
There are a lot more benefits of Ruler Analytics. We won’t go into those here as we’ve got a blog that reveals everything you can discover in Ruler. If you have any questions on how to use Ruler, book a demo, and we’ll show you how it can help transform the data in your CRM.
Book a demo
Now that we have our lead and opportunity data, it’s time to match them back to Facebook.
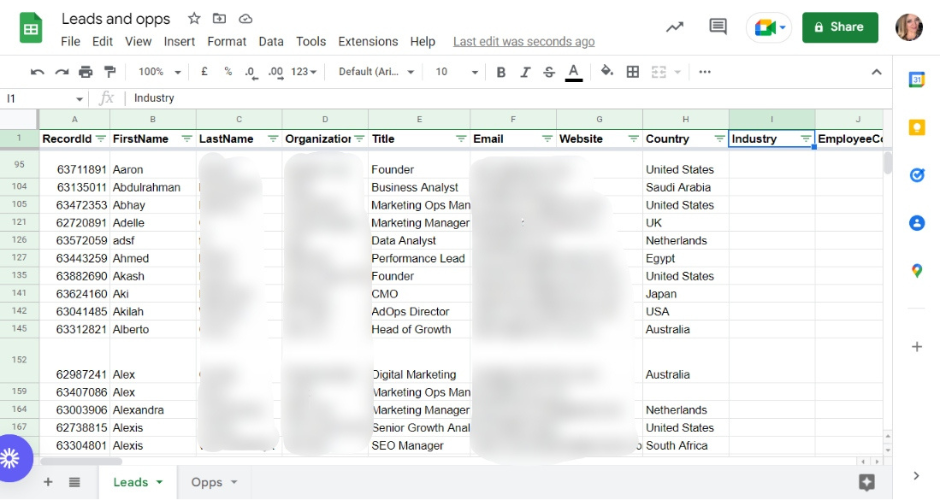
For this example, we’re going to stick with campaign-level reporting. You can attribute leads and opps to your ad sets and ads depending on how granular you want your reports.
For leads, we highlight all rows and create a pivot table.
For the pivot table, we select Rows > Campaign > Ascending.
Then, we select Values > Campaign > Counta.
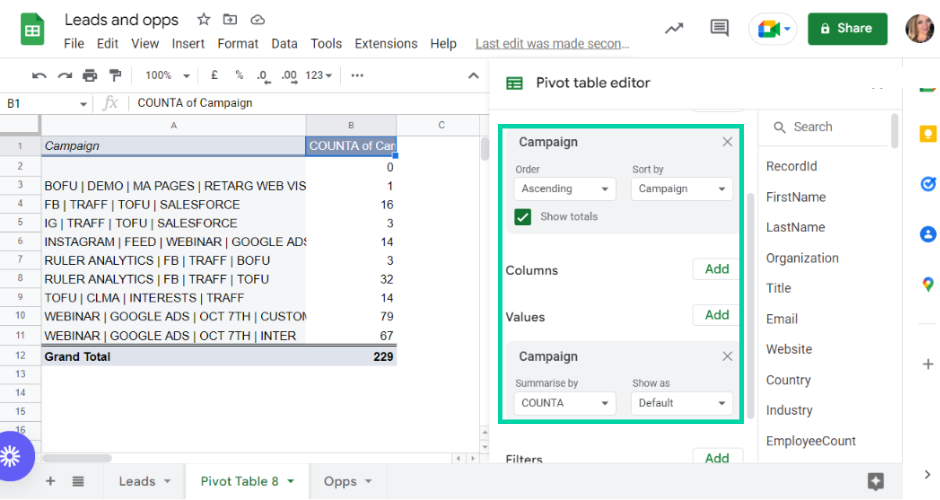
This shows us how many leads each Facebook campaign has added to the pipeline.
We repeat the same process for our opportunities and add the data to our reporting document.
Note: The numbers in this example are fictitious and are only used here as an illustration.
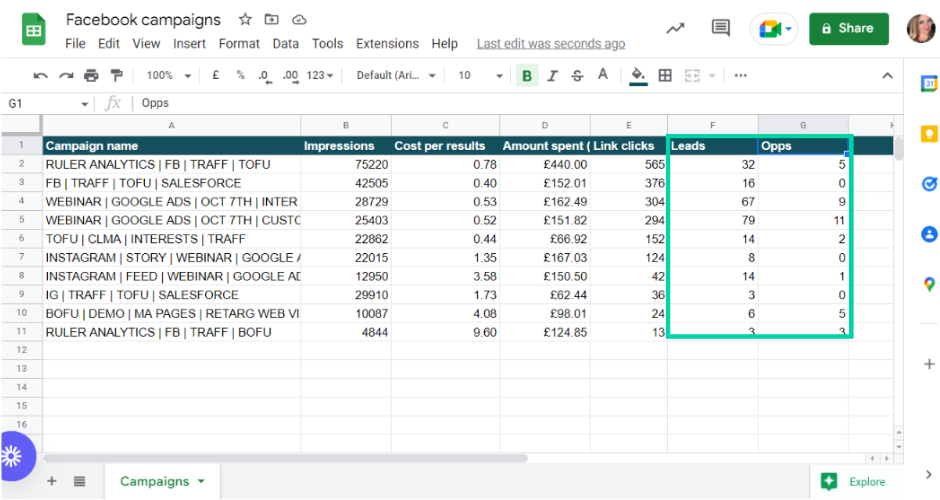
Now for the most important stage. It’s time to calculate your Facebook ROI.
To track our Facebook ROI or ROAS, we first need to find out how much revenue each Facebook campaign has generated.
To do this, we go back to the Google Sheet with our leads and opportunities. We copy our “Won” opportunities for the month and paste them into a new separate sheet.
Next, we create a pivot table and follow the same steps: Rows > Campaign > Ascending.
But, once we get to Value, instead of selecting “Campaign“, we choose “BidAmount“.
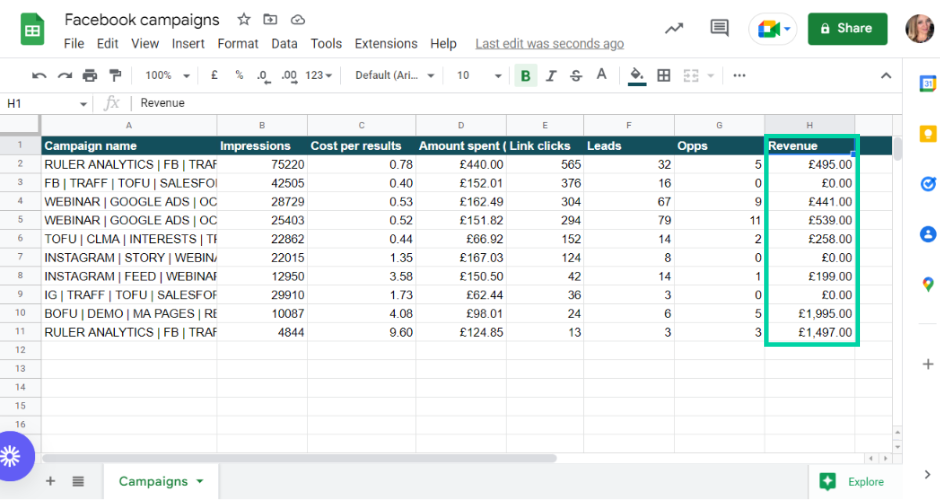
If set up correctly, we should see how much monthly recurring revenue each Facebook campaign has contributed to the pipeline.
We add the revenue values into the spreadsheet alongside our engagement and lead data and get to work calculating our ROI and ROAS.
Note: The numbers in this example are fictitious and are only used here as an illustration.
Ruler integrates with almost any tool. One popular integration is Google Analytics.
Marketers can feed revenue data into Google Analytics and track Facebook’s impact on revenue directly in the acquisition report.

Related: How Ruler enriches your attribution reports in Google Analytics
Using the comparison tool in Google Analytics and revenue data from Ruler, you can see how the data offered by each model affects your understanding of your Facebook performance.
That’s not all.
Ruler has call tracking and can help you quickly determine which Facebook ads are working best to drive inbound leads over the phone.
Related: How Ruler sends offline conversion data to Google Analytics
This data can also be passed on to Google Analytics, allowing you to measure your inbound phone calls from Facebook (including the revenue) against all your traditional metrics.
Multi-touch attribution is the first step towards improving your company’s collective understanding of its digital marketing and Facebook ROI.
But for maximum visibility, you need marketing mix modeling.
With the release of iOS 14.5 and other privacy-focused changes (e.g. the death of third-party cookies), traditional user-level attribution has become less effective for tracking users across multiple touchpoints.
But this is where marketing mix modeling comes in handy. Let’s use Ruler’s MMM, for example.
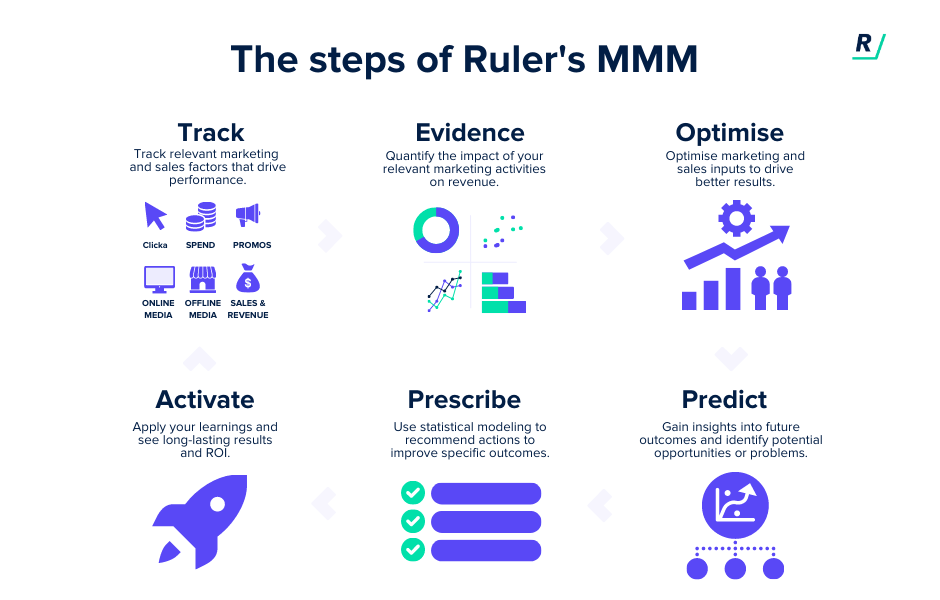
Ruler’s marketing mix modeling uses aggregated channel-level data.
It takes a holistic approach to analyse marketing impact by looking at all of the different channels (including Facebook) a company uses to promote its products or services and how they work together to drive sales or revenue.
This includes both online and offline channels, such as TV ads, social media, email campaigns, and in-store promotions.
That means marketers can continue to use attribution to track click path data and enrich their CRM with information about lead’s online activity. But can also use MMM to fill in the gaps of attribution.
There are several benefits to using Ruler’s MMM, and these include:
If you use Facebook advertising as part of your marketing strategy, then tracking your ROI is an absolute necessity.
It’s the best indicator for determining whether or not your campaigns are generating revenue for your business.
Ruler offers a complete solution that can give you all the metrics you need to prove the ROI of your advertising campaigns.
Related: How businesses use Ruler to improve their ROI
If you would like to see benefits, book a demo with our analytics experts and see how Ruler can improve the quality of your reporting.
This article was originally published in November 2020 and last updated on 6th March 2023 for freshness.