Google Analytics Attribution provides you with a holistic view of your marketing performance across multiple channels.
Attribution in Google Analytics is a powerful feature that provides you with better visibility into the full customer journey across several touchpoints.
When used correctly, it can help you understand how different marketing channels impact your traffic and conversions, allowing you to see where you’re getting the greatest return from your investments.
For this article, we discuss:
Pro Tip
Have you heard about our free attribution e-learning platform? Learn about marketing attribution at your own pace—any time, anywhere. Perfect for marketers at all levels.
Sign up for attribution academy (it’s free)
There are many marketing touchpoints through which users can interact with your brand.
Related: What is a marketing touchpoint and how to track them
As a result, customer journeys can take any form and often last days, weeks, sometimes even months. In fact, during a study, we found that nearly 20% of companies endure sales cycles lasting more than four months.
Google Attribution was released to simplify the complex issues surrounding multi-channel reporting.
Attribution aims to help marketers gain a better understanding of how multiple channels contribute to the customer journey.
Pro Tip
Tracking customer journeys allows you to gain a deeper understanding of your visitors and unlock valuable data about their interactions and behaviours. Download the guide below and follow the complete lifecycle from awareness to purchase.
How to track and compare your customer journeys
There are five reports available in Attribution:
By default, Google Analytics uses the last-click attribution model.
All credit is assigned to the last channel a user engaged with, and any previous interactions are ignored.
In theory, last-click attribution seems like the best way to measure the performance of your marketing channels, but it doesn’t tell you the full story.
If you only pay attention to last-click attribution, you are effectively ignoring the performance of your entire marketing activity.
Let’s say, for example, Jamal sees an advert for a car on Instagram.
He clicks through to the website to view more vehicles. He doesn’t enquire on the initial visit because he needs to do more research on the brand before making his final decision.
He does, however, sign up for an email newsletter where he’s sent a discounted deal on a particular car. A week later, Jamal completes a brand search in Google, clicks on an organic listing and ends up filling out an enquiry form.
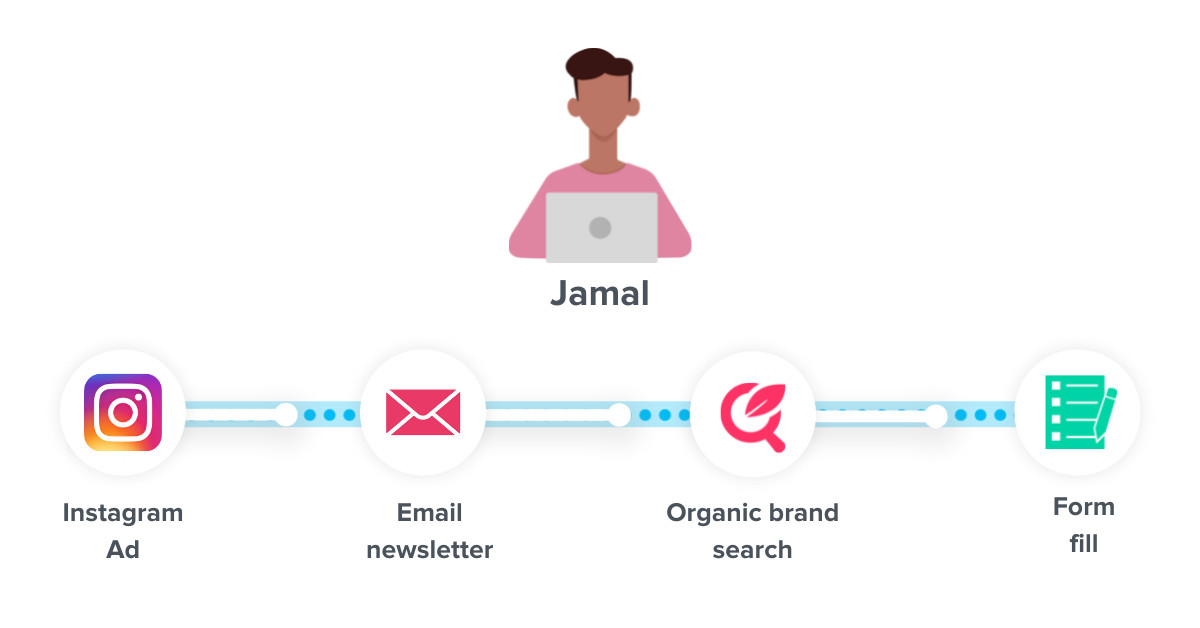
If you were to use the last-click model in Google Analytics, then the credit for the form enquiry would go to organic search, ignoring both Instagram and the newsletter.
Though you can agree, Instagram and the newsletter played a huge role in Jamal’s customer journey.
Last-click attribution doesn’t provide a clear picture of where your sales are coming from, or how customers move through the funnel.
However, with Google Attribution, users can look beyond last-click and make smarter decisions based on full-funnel attribution data.
Whether you’re using Google Attribution for the first time or looking to switch from one model to another, here’s a basic guide on how to do it in both Universal Analytics and GA4.
1. Click on “Admin” in the bottom left.
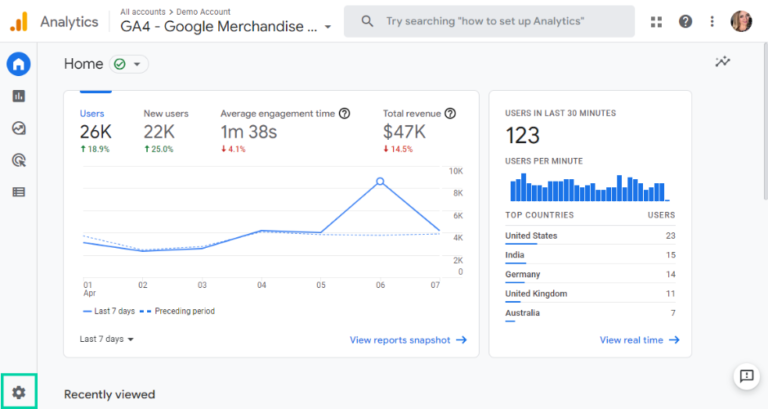
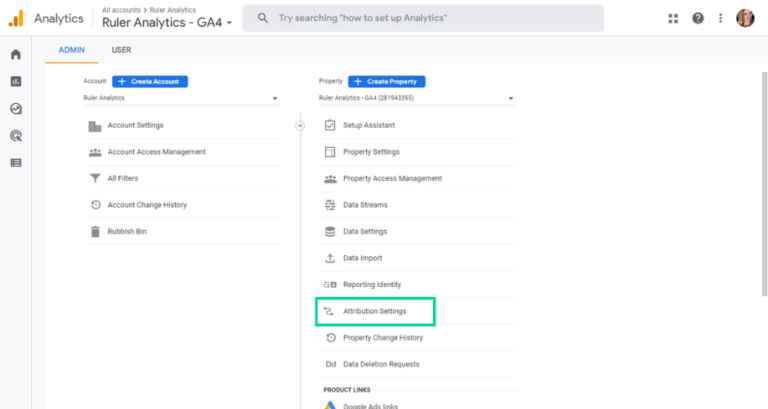
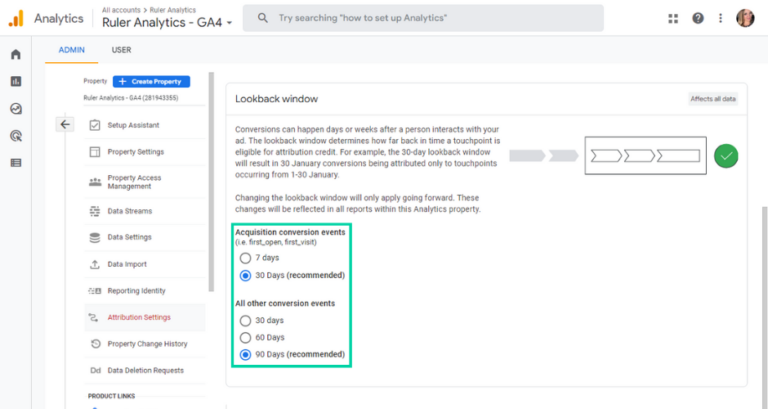
2. In the property column go to “Attribution Settings”. Here you’ll see all the different attribution models to choose from.
3. Under “Reporting attribution model”, select your desired option from the drop-down. Google Analytics 4, by default, will recommend the data driven attribution model.
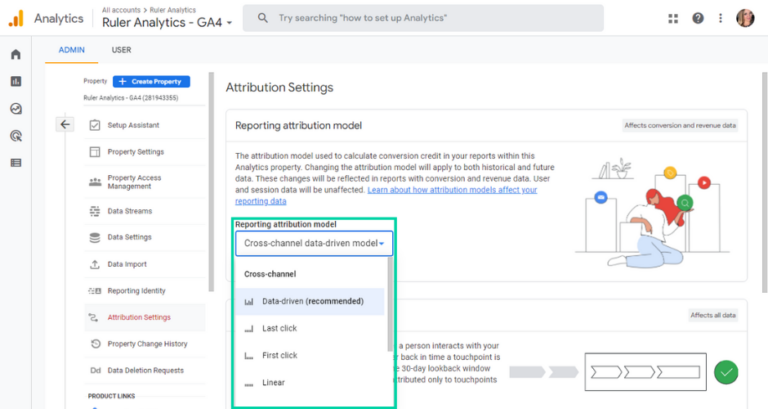
4. You’ll also have the option to adjust your lookback window. Once you’re happy with your selection, hit “Save”.
And that’s all there is to it.
The best thing about GA4 is that you can change your attribution model as many times as you like to find the right fit for your reporting.
GA4 and Universal Analytics don’t work the same. Universal Analytics only allows you to use the default attribution model in the acquisition report to track conversion performance.
Having said that, you can use the model comparison tool to compare your data using alternative attribution models. Here’s how to find it.
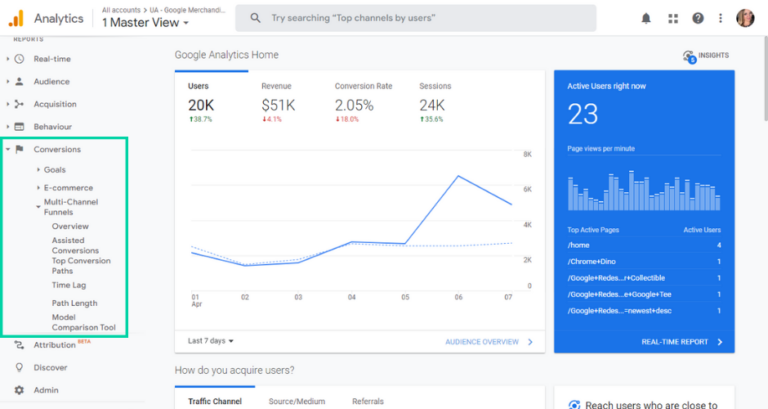
1. In your account, navigate to “Conversions” > “Multi-Channel Funnels” > “Model Comparison Tool”. This report lets you compare attribution models and assess the way you’re giving credit to your different marketing channels.
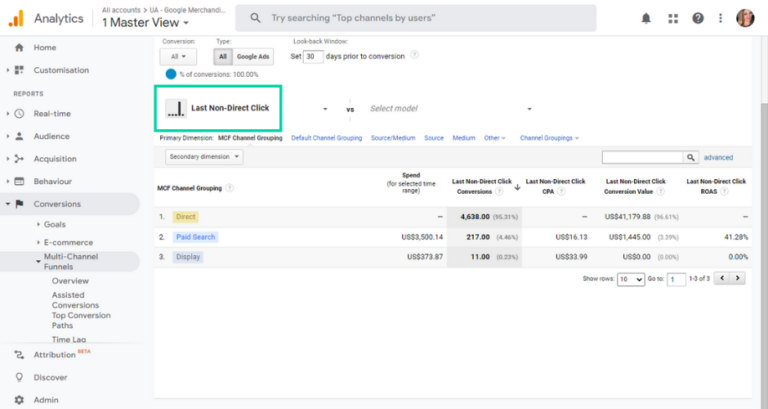
2. If you’re using this report for the first time, you’ll see the drop down menu is assigned to “Last Interaction”. You’ll need to change this to “Last Non-Direct Click”. This will reflect what you see in the standards reports of Google Analytics.
3. Now you can select additional attribution models to view and compare your conversion and revenue data. You should also have an option to create your own custom attribution model. The Custom attribution model gives you more flexibility and allows you to specify the weight of credit to give to first, last, and middle touchpoints.
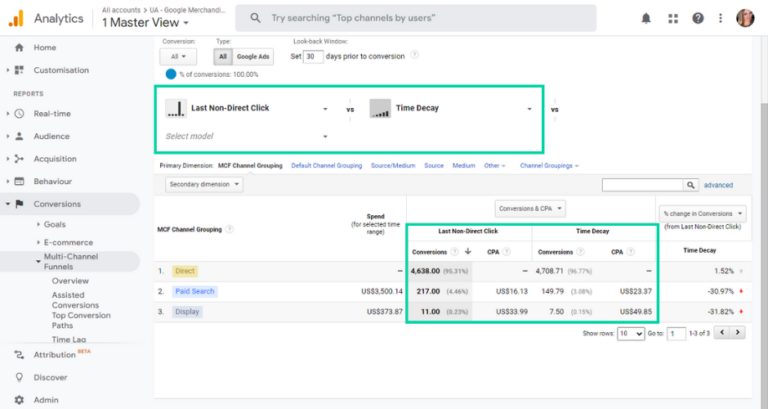
Creating and comparing attribution models in Google Analytics is key as it provides you with a clear view of how each channel and campaign contributes to the customer journey. The following is a list of rule-based attribution models available in Analytics.
Related: What is attribution modelling and why is it important
All of these attribution models will generate various results, as they measure the value of your touchpoints differently. You can learn more about these attribution models and more in our guide to attribution modelling.
Unlike other models we’ve discussed, Google’s data-driven attribution analyses all of your marketing touchpoints.
Related: Marketer’s full guide to data-driven attribution
It considers factors such as time from conversion, device type, number of ad interactions and more.
The data-driven model distinguishes what happened from what could have occurred to conclude which touchpoints are most likely to drive conversions.
Let’s say Ella wanted to buy a new pair of shoes.
Ella starts her journey on Google using the search term “latest shoes for women”. She clicks on a paid ad and browses the website.
Ella finds a pair of shoes that she likes but doesn’t purchase them straight away. Later that day, Ella returns to Google.
This time, Ella completes a brand search, and instead clicks on an organic listing. Ella finds the shoes and makes a purchase.
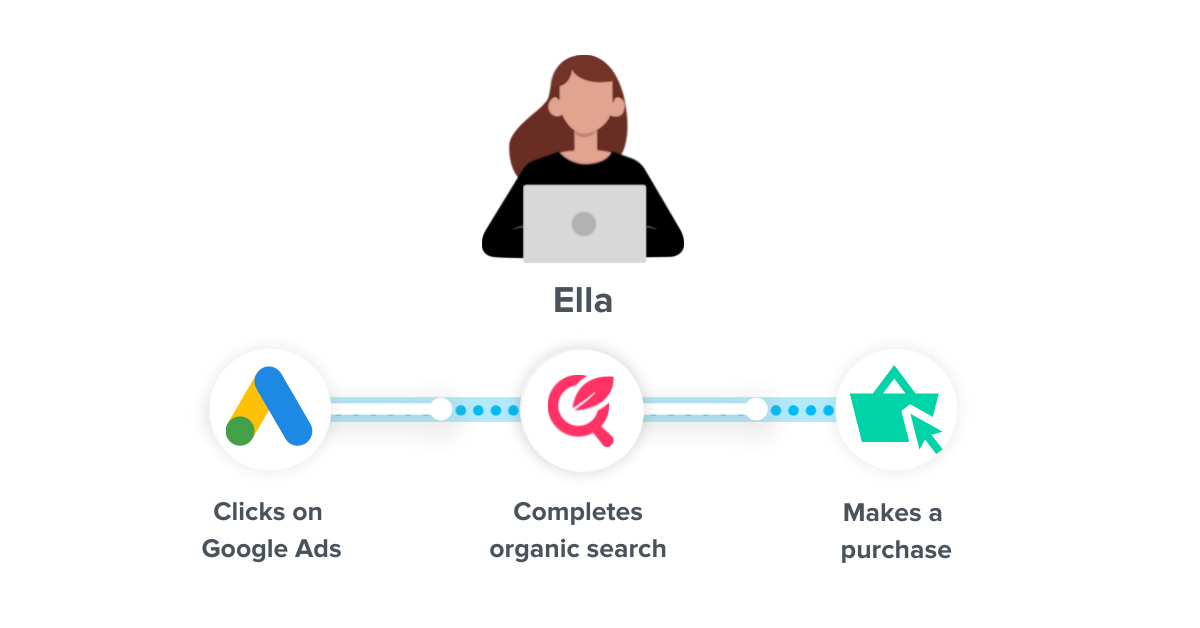
Using a data-driven attribution model you can gain a better understanding of Ella’s journey and your customers path to conversion.
Using your unique account data and machine learning technology, Google can analyse both converting and non-converting pathways to learn how different touchpoints impact conversion outcomes.
Such technology allows Google to assess and calculate the contribution of each click interaction more accurately.
Pro Tip
Did you know that Ruler is a visitor-level marketing attribution product? Using Ruler, you can to track each touchpoint along the path to conversion and attribute revenue to those touchpoints influencing your customer journeys.
How to view full customer journeys with Ruler
Google Attribution has made it possible for marketers to measure the effectiveness of their marketing across various touchpoints at no additional cost, but it isn’t perfect.
Many apps use a default attribution window of 30-days, including Google Analytics.
When you set up conversion tracking in Google Analytics, your attribution reports automatically show how users engage with your digital channels for up to 30-days before a conversion takes place.
Related: How to set up and track conversions in Google Analytics
You can, however, adjust this between 1 to 90 days.
If your company sells a high-value service or product, chances are your sales cycle is long and drawn out across many months.
Often longer than 90 days.
Why is this important?
Well, let’s say a user visits your website for the first time via a PPC ad. They navigate around your website but don’t convert.
After three months, that same user returns to your website via an organic search.
They fill out a form to learn more about your services and end up converting into a customer.
Even though there are two crucial interactions, Analytics would only have a recollection of the organic touchpoint as the ad click happened beyond the 90-day timeframe.
Google Analytics, in particular, does a good job of collecting online conversion data such as form completions. However, when the subject of offline conversion tracking comes up, many marketers get that glazed-over, deer-in-the-headlights look in their eyes.
While there are many digital channels through which your customers can get in touch with you, phone calls remain a popular and preferred method of communication.
That said, offline conversions are often deliberately ignored, mainly because marketers lack the infrastructure and knowledge to set up and track offline conversions in Google Analytics. But, by not tracking calls, marketers are missing as much as 80% of conversions.
Pro Tip
Without offline conversion tracking, it’s likely you’re not getting a true picture of your lead generation performance. But, it doesn’t have to be difficult with the right tool in place. Download our eBook on offline conversion tracking and see which marketing sources, keywords and ads are driving the most phone calls.
Download the guide on offline conversion tracking
Google’s data-driven model needs sufficient data for it to work successfully.
You must have at least 15,000 clicks and 600 conversions within 30-days to be eligible for this attribution model.
If your conversion data doesn’t meet the required threshold, then unfortunately, you can’t take advantage of the opportunities of data-driven attribution in Google Analytics.
Attribution modelling in Google Analytics on its own simply doesn’t give you the full picture you need to measure and optimise your marketing efforts.
To unlock the data you need to track users throughout the customer journey and close the loop on conversion and sales reporting, you need a solution that can:
1. Capture online and offline interactions throughout an individual customer journey, such as the first and last-click source.
2. Attribute revenue back to your marketing channels and can support long and complex sales journeys.
3. Integrate with Google Analytics along with other data sources such as your CRM and Google ads to gain visibility of your conversion path.
Using a tool like Ruler, you can send marketing source data to your CRM and enrich your Google Analytics with web form, phone call and live chat activity to understand which marketing sources generate the most revenue, both online and offline.
Related: How Ruler enriches your attribution reports in Google Analytics
In brief, Ruler is a marketing attribution solution which aligns revenue from your CRM with marketing data in Google Analytics so that it can track your visitor’s multiple touchpoints to measure and attribute value accurately across the entire customer journey.
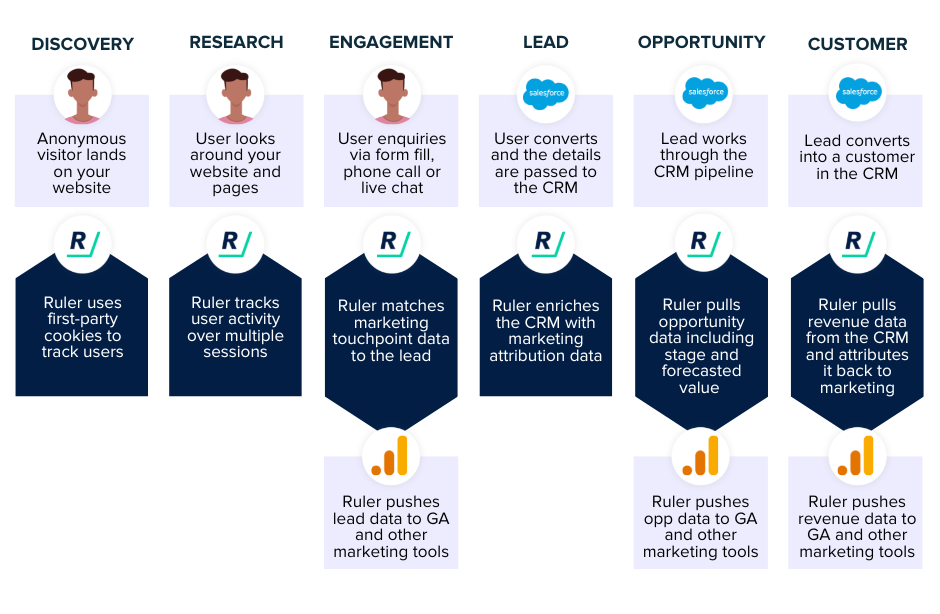
1. Ruler tracks each anonymous visitor to the website over multiple sessions, traffic sources and keywords.
Related: How to view full customer journeys in Ruler
2. When a visitor converts, data is captured via form, call tracking or live chat on your website.
3. Ruler matches the real user’s details with their marketing touchpoints.
4. The marketing and conversion data is sent to your CRM. Marketing data includes channel, source, campaign, keyword and/or landing page.
5. Ruler’s attribution solution allows you to analyse the impact throughout the entire sales cycle. Once the opportunity is closed into revenue, Ruler passes this data back to your Google analytics and paid media tools so that you can report on revenue.
Ruler makes it easy for businesses to track marketing-generated revenue and attribute it across the entire customer path. Learn exactly how Ruler attributes revenue to your marketing.
Ruler is an official Google Analytics partner. With Ruler in place, you can definitively prove which online marketing channels generate offline sales revenue within your Google Analytics account.
Related: How Ruler sends offline conversion data to Google Analytics
Offline conversion tracking allows marketers to match leads to revenue and evidence which campaigns drove offline sales.
This helps businesses align sales and marketing activity, measure true ROI for campaigns and optimise ads based on value to drive higher quality leads.
Ruler’s call tracking uses dynamic insertion to assign a unique phone number to every website visitor.
Then, when that phone number is called, Ruler will attribute the offline conversion to the marketing channel that the visitor arrived from. You can find more information about that here.
Once you implement attribution, you’ll wonder how you went without it.
There are multiple types of attribution models you can use, and the best one will depend on your business and unique situation.
When you understand the benefits and disadvantages of different attribution models, and have a tool that can help you collect and filter your data, you can optimise for higher-quality conversions, which in turn, will lead to a better return on investment.
Want to talk about attribution and get a deeper understanding of your users’ conversion journey?
Book a demo to learn more about the opportunities of Ruler’s marketing and revenue attribution.
This article was originally published on 17th August 2020, but was updated on 10th May 2022 for freshness.