We all know Instagram is the perfect platform for reaching potential customers. But tracking its performance isn’t easy. Keep reading to find out how to track Instagram traffic using Google Analytics.
Important Note: Google Analytics is sunsetting Universal Analytics in July 2023 and replacing it with GA4 tracking. For this article, we’ll mostly be focusing on GA4 to ensure you have the most up-to-date information.
Social media platforms have become an essential part of our daily lives.
The data backs it up. The average user spends 2 hours and 31 minutes daily on social media.
Amongst the many platforms available, Instagram stands out as one of the most popular.
With millions of active users, it’s quickly become a go-to platform for advertisers looking to reach their target audience and drive more leads.
While Instagram is an amazing source for traffic and leads, it’s not the easiest platform to measure out of the box.
But there are workarounds.
In this blog, we will explore the different ways businesses can track their Instagram traffic in tools like Google Analytics and gain valuable insights into their ad performance.
Here’s what you’ll learn:
💡 Pro Tip
Meta has seen extreme changes to its tracking and attribution following the iOS 14.5 update. Many marketers are struggling to attribute leads and sales back to Facebook and Instagram. But by implementing a marketing attribution tool like Ruler, you can bypass the iOS issues and get a clear view of your ROI and ROAS.
Book a demo to learn more
You can Instagram Insights to traffic and followers clicking through to your website. We’ll walk you through Instagram Insights first. Then we’ll show you how to track Instagram traffic in Google Analytics.
If you only use the link in your bio to drive traffic, then you can have a quick glance at how many people are clicking onto your site directly on Instagram.
Firstly, remember that you’ll need a business account to be able to view this data. If you have a business account already, then head to your insights section on your profile.
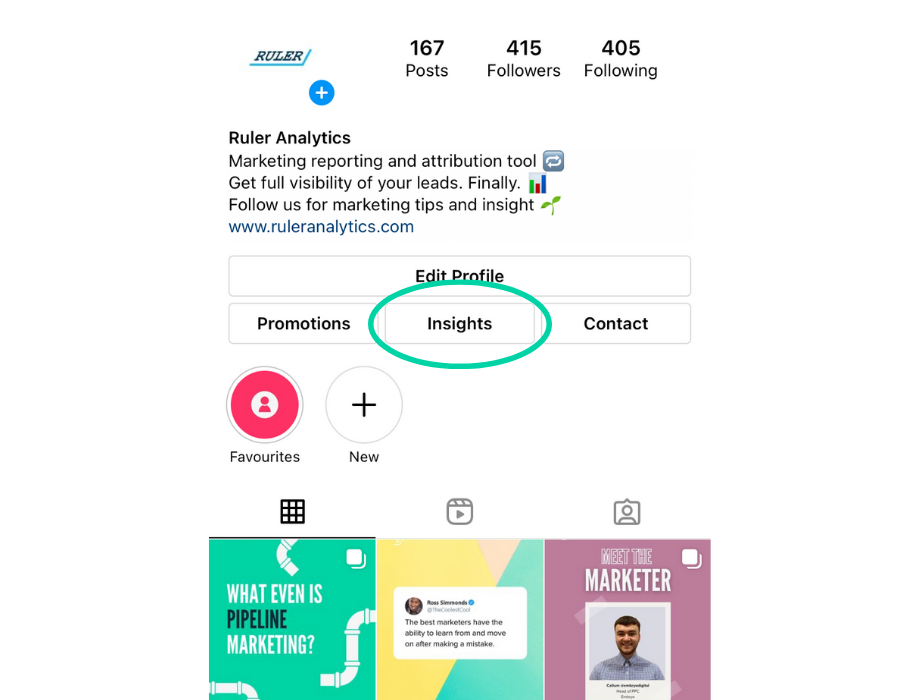
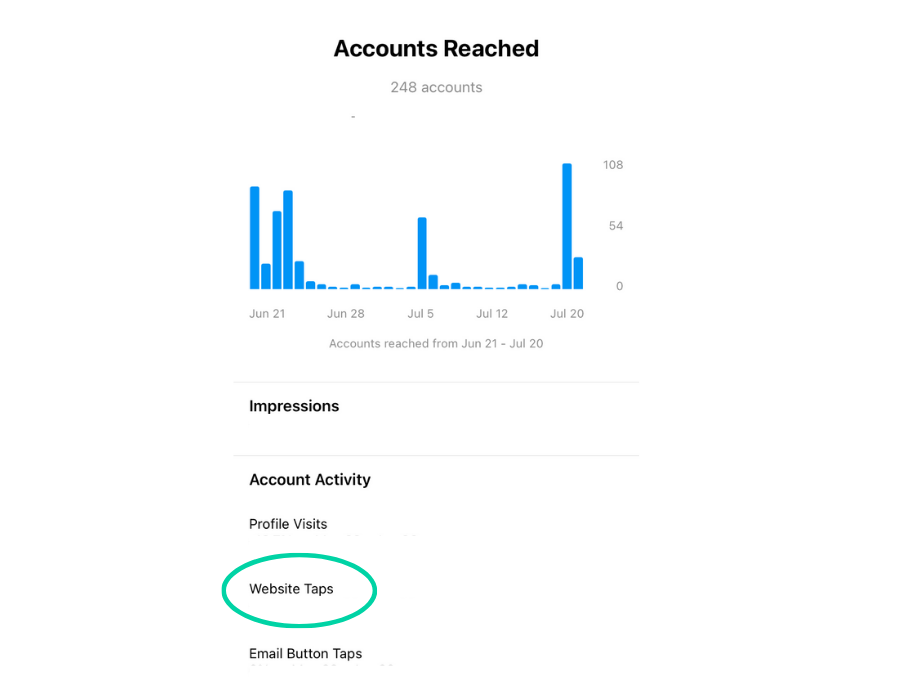
From there, select ‘see more’ under ‘Accounts Reached’ to view all engagements with your profile and your content.
In this section, you will find ‘Website Taps’ where you can see how many people have clicked on the link in your bio.
Thanks to a change to Instagram, you’ll have unlocked the ability to share links in your stories no matter how many followers you have.
But what about the impact on traffic from this source? You can view the individual click performance on your stories within the insights section on Instagram.
Head to insights again. This time, scroll down to where your stories are. Click through and then toggle the metric on the top left to link clicks.
Then, you’ll be able to see how many clicks each story has driven.
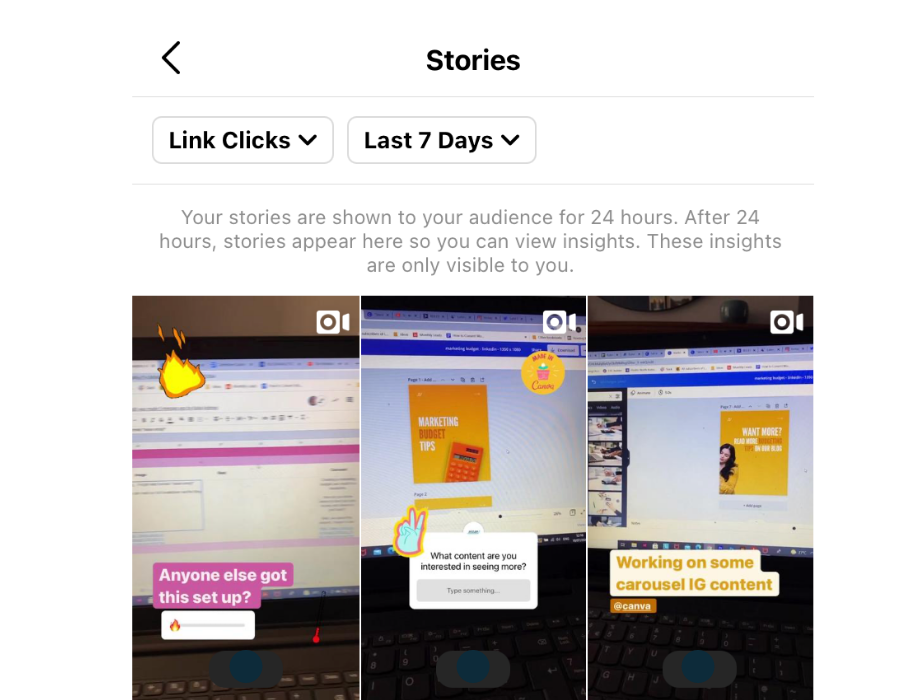
Of course, if you don’t have any links then it’ll say zero.
While Instagram goes part way to give you your traffic data, it’s only half of the story. So you can see clicks, but what does that actually mean?
These users could click and bounce right off your website. Or, they could convert straight away into a sale. How are you working that out?
Google Analytics offers a simple solution to this problem.
With Google Analytics, you can track the traffic coming from your Instagram, monitor user engagement and compare performance against other traffic sources, keywords, etc.
But before you start tracking Instagram traffic in Google Analytics, there are a few steps you need to take.
These include:
The first step is to add UTM tags to your links on Instagram. This doesn’t just work for Instagram. It works for any external source that you use to drive visitors to your website.
UTM tagging allows you to set details against a URL, such as the source e.g. social, and the campaign. This lets you segment your data in Google Analytics and view specific link clicks for one URL.
Related: How to accurately track link clicks in Google Analytics
If you don’t add UTMs to your links, your Instagram traffic will show up as direct in Google Analytics. That’s because when you click a link in the mobile application, Instagram opens the link directly on your mobile browser.
Related: What is direct traffic in Google Analytics?
But with UTM tagging, you can make sure that Google Analytics logs traffic exactly as you want it to and that it’s accurate 100% of the time.
Here’s a quick guide on how to set up a tracked link using Google’s URL builder.
First, head to Google’s URL builder.
From there, add your URL into the box called ‘Website URL’. For campaign source, you’ll want to highlight the referrer. For example, is it coming from Facebook, Google, or another particular website?
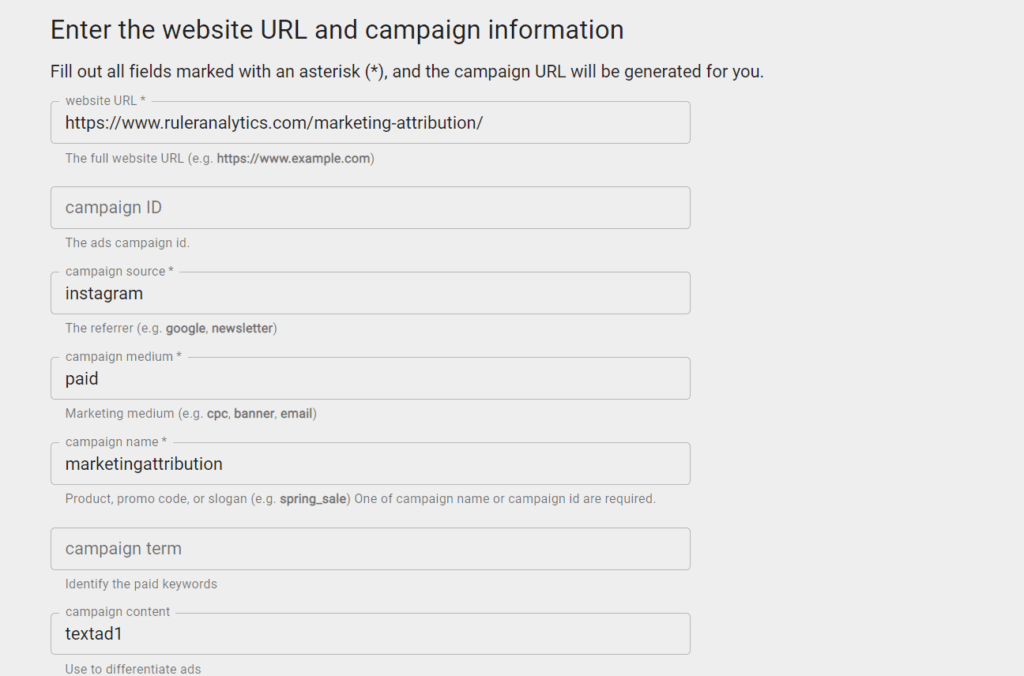
Then, select your medium. This refers to how the user arrived at your link. For example, organic, social, paid etc.
Next, add in your campaign name. This will allow you to group web performance based on a particular campaign name.
You then have campaign terms and content to break down differences between your links further. For example, if you were using this link on a paid post, you might use terms and content to differentiate from an A/B test.
And there you have it, your complete unique URL.
Now that we’ve set up our UTM, it’s time to add it to Instagram.
In this example, we’re going to add a UTM to one of our Instagram ads.
To add trackable links to your Insatgram ad, simply scroll down to “desination“ and enter your UTM link into the field labeled “website url“.
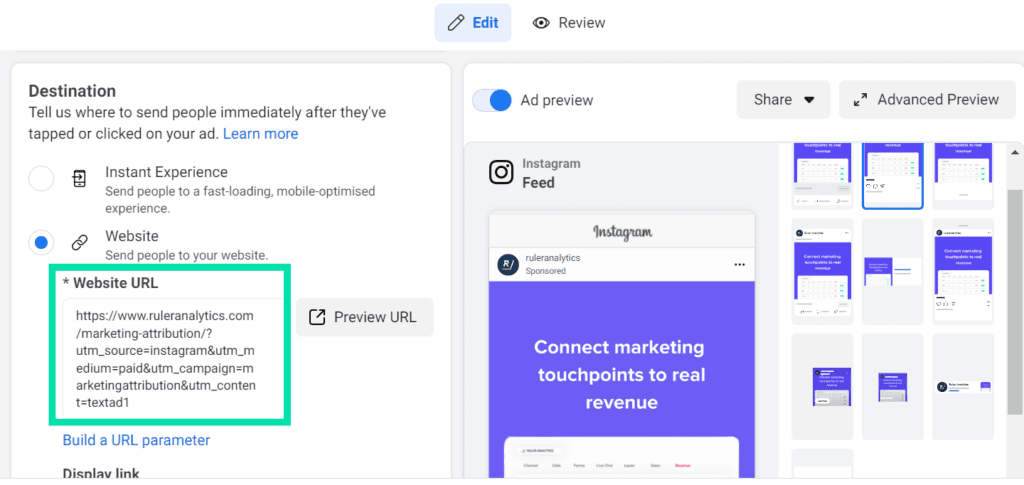
Once you’ve added the UTM to your Instagram posts, you’re ready to start tracking its performance in Google Analytics.
Your Instagram traffic will get pulled in automatically by Google Analytics 4 as long as you’ve set up your UTM codes correctly.
To check, go to Reporting > Acquisition > Traffic Acquisition.
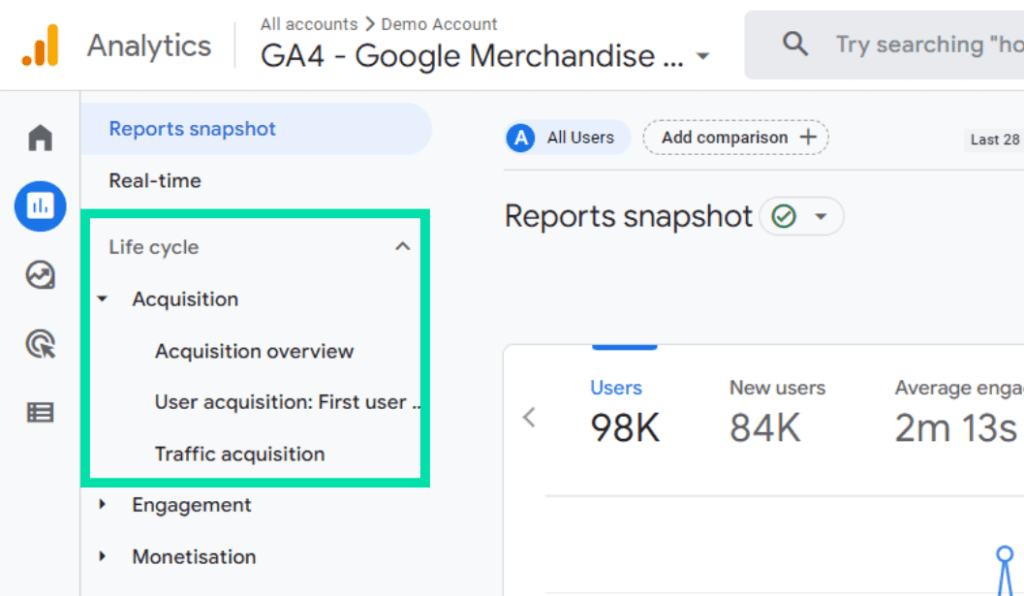
From the drop-down, change the channel group to view things like:
You can also use custom templates in Explorations to create various types of visualisations, including bar charts, line charts, pie charts, and tables, to help you understand your data.
Tracking Instagram in Google Analytics is the first step towards a complete understanding of your website and its visitors.
But there’s one significant issue with Google Analytics that we haven’t addressed yet.
The data you see in Google Analytics is anonymised.
Google Analytics uses first-party cookies to capture data on your Instagram traffic and assigns each user a unique anonymous id.
Related: How to collect first party data in a cookieless word
You can click-through and see the different interactions each visitor has completed on your website (pageviews, events and purchases).
What you cannot do is assign personally identifiable information, such as email addresses or phone numbers, to user data.
But why is this a problem?
Well, if you can’t see where visitors are converting into leads, you can’t prove Instagram’s impact on pipeline generation.
It’s why marketers have begun introducing attribution and MMM technology into their existing tech stack.
Don’t take our word for it. A recent study suggests that the marketing attribution software market is expected to reach USD 12.9 Billion by 2031.
💡 Pro Tip
Not sure what marketing attribution is or how it works? We like to think of ourselves as experts, so we’re here to help. Read our full guide to marketing attribution
To show you how attribution works, we’re going to use Ruler Analytics as an example.
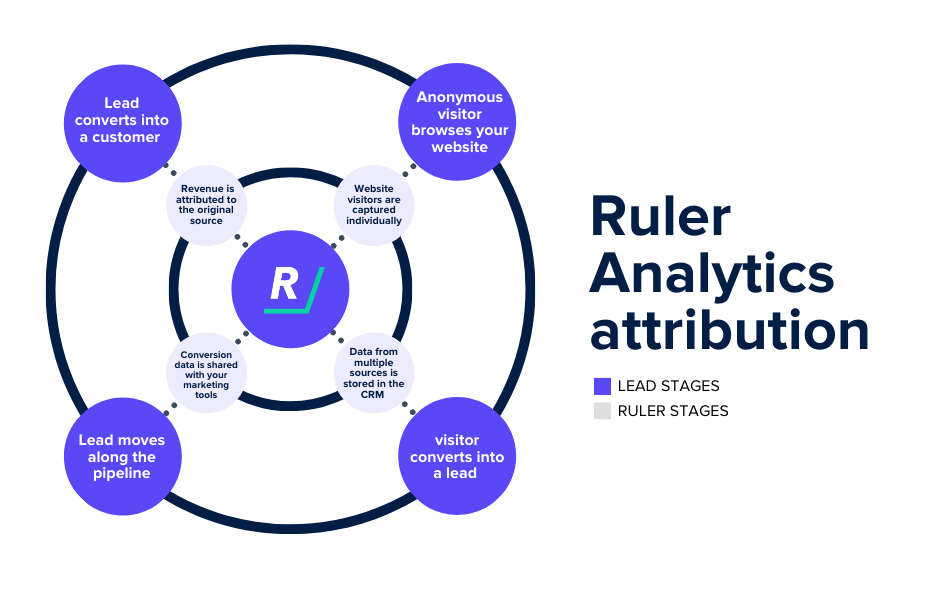
Ruler is a marketing attribution tool that allows you to connect your website to your customer database and marketing tools.
Once your tracking links are set up, Ruler can monitor each and every visitor to your website and collect data on their session data and referrals.
When that user becomes a lead, Ruler will pass all of the data held on that user over to your CRM or whatever you’re using to monitor leads and customers.
Ruler will continue to work in the background, monitoring that user and their activity.
When that user closes into a sale, Ruler will scrape the revenue data assigned to it and fire it back into your marketing dashboards.
That means, you’ll be able to look in Google Analytics and see a direct revenue number against your Instagram traffic. And even better, you’ll be able to assign revenue by campaign too.
So for any campaign terms you use, you’ll be able to view revenue against them directly in Google Analytics.
What better way to highlight the impact of your Instagram?
Attribution can offer valuable insights into what’s working and what isn’t, but it does have a few blind spots:
One option is to use marketing mix modelling (MMM) in conjunction with attribution to help fill these missing gaps.
Let’s revert to Ruler Analytics to explain how it works.
Ruler’s marketing mix modelling (MMM) uses statistical analytics to help businesses analyse the impact of different marketing inputs or variables on their sales or other KPIs.
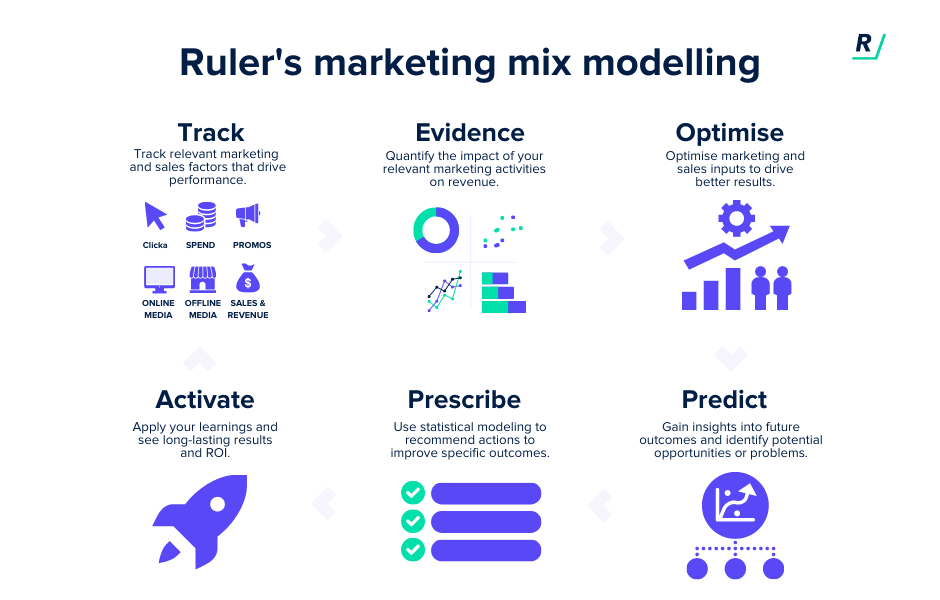
It collects data from various sources, including sales data, marketing spend data and other external factors that may impact sales and revenue.
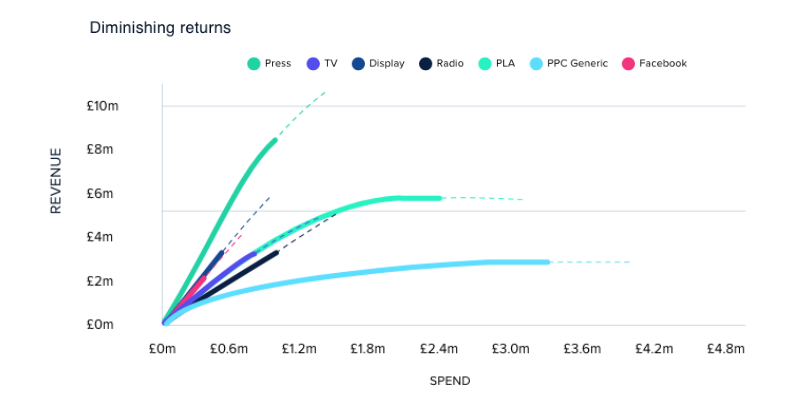
This helps you identify which of your Instagram efforts are generating the best results and which ones are not. And you can use this information to optimise your Instagram and Facebook campaigns for better results in the future.
Additionally, Ruler’s MMM can help you determine the optimal allocation of your advertising budget across various marketing channels, including Facebook and Instagram, to maximise your return on investment (ROI).
💡 Pro Tip
Want to learn more about Ruler’s attribution and MMM? Book a demo of Ruler to see it in action and how it can support you to connect the dots between your sales and your marketing
And there you have it.
Now, you can track Instagram traffic directly in Google Analytics and understand how the platform is working to drive or influence web visitors and conversions.
Don’t forget. By utilising tools like Ruler, you can gain more valuable insights into your advertising performance and make data-driven decisions that will help take your Instagram marketing to the next level.
