Now that we’ve waved goodbye to the Facebook attribution report, what is the next move for advertisers going forward?
It’s been a tough year for social media advertisers.
The release of iOS 14.5 (now iOS 15) had a substantial impact on social media platforms.
One platform significantly affected was Facebook.
In January 2021, Facebook began making changes to its analytics in preparation for the iOS 14 rollout and announced it was waving goodbye to its attribution tool.
The news that Facebook was shutting down its attribution tool left marketers in a state of panic.
And many have been left scrambling to find alternative ways to track and measure their campaign performance.
If you’re one of those marketers looking for a way to adapt and pivot your Facebook strategy in response to iOS 15 privacy changes, this guide is for you.
Keep reading to learn how to stay on top of your Facebook ads in a post iOS 14 world.
What we’ll discuss:
Pro Tip
Are you new to marketing attribution or looking to grow your existing knowledge? Learn the basics of marketing attribution, and models, and learn which ones work best for you in our easy-to-follow guide.
Complete guide to marketing attribution
Table of Contents
So that we’re all on the same page, let’s quickly explain how attribution tracking works on Facebook.
Facebook’s attribution tracking gives credit for a conversion to an ad after someone saw or clicked it after a specific period.
Related: What is attribution modelling and why does it matter
Its purpose is to help marketers gain a better understanding of how their ads and campaigns contribute to pipeline generation.
Unfortunately, as of August 25th 2021, the Facebook attribution tool doesn’t exist.
This was disappointing news for advertisers.
One of the main benefits of Facebook’s attribution tool was its ability to add click and impression tags to other ad platforms and present the data within its reporting suite.
This handy integration gave advertisers a more holistic view of their campaigns and made it a lot easier to track ROI and ROAS.
Facebook stated its reason for removal as an inability to track events and behaviour in a post-iOS 14 world.
“Apple has announced changes related to iOS 14 that may soon impact your reporting in Facebook Attribution. As more people opt- out of tracking on iOS 14, a significant decrease in the number of reported conversions is possible. You’ll also see fewer impressions and clicks reported for sources off Facebook. In addition, the statistical modelling used to estimate conversions that was introduced on May 1, 2020 will soon no longer be incorporated in Facebook Attribution reporting.”
Source: Facebook
When one door closes, another opens.
Long before iOS 14, you may recall that Facebook had two separate features: conversion windows and attribution windows.
The conversion window referred to the length of time after someone either clicked or viewed your ad and then completed a conversion (i.e. a purchase, an app download or a form on your website.)
The attribution window, however, referred to the length of time through which a conversion or action was tracked and attributed to a particular ad set.
Facebook has since merged these two separate features into a single attribution setting and released the following statement to explain the change:
“We merged the account level attribution window and the ad set level conversion window into a new ad set level attribution setting that can be accessed during campaign creation. This new attribution setting ensures that the conversions we measure are the same ones that inform campaign optimisation and allows increased clarity when analysing ad performance. We introduced a corresponding Attribution setting column in the reporting table so that advertisers can see which setting their ad results are optimised and reported under.”
Source: Facebook
Facebook’s decision to combine the conversion window and attribution window for increased clarity when analysing ad performance has significantly impacted the time frame in which marketers can attribute conversions.
Facebook will no longer support 28-day click, 28-day view and 7-day view windows under its new ad set level attribution setting.
Instead, Facebook will allow marketers to choose from the following options under the new attribution setting:
Despite a much shorter reporting window, Facebook has claimed this change will have no impact on the delivery or performance of your ads.
“While you may see fewer reported conversions with a 7-day window compared to a 28-day window, this is a more sustainable measurement strategy that will support digital privacy, be resilient to future browser changes and enable businesses to better measure the impact of their marketing investments on Facebook.”
Source: Facebook
Facebook’s attribution reporting has made it possible for marketers to measure the effectiveness of their ad campaigns at no additional cost, but it isn’t perfect.
As it stands, the attribution data is limited to Facebook, Messenger and Instagram. This is troublesome for marketers that use other platforms, such as Google Ads and LinkedIn to drive leads and revenue.
As we’ve just discussed, the attribution window for Facebook is a 7-day click and 1-day view.
The sales landscape looks vastly different from that of just a few years ago and the path to purchase is not as simple as it once was. If your customers advance through a complex sales journey, then a 7-day window isn’t going to cut it.
While Facebook can do many amazing things, it can’t track everything. Facebook does a great job at telling you how many conversions your ads have generated, but it can’t show you the specific leads behind each conversion action. Generating leads is essential, but identifying quality ones is even more important. And, out-of-the-box, Facebook can’t provide the data you need to specify the quality of each lead.
It’s no secret that the rise of iOS 14 and the age of data privacy has left marketers in the dark over their marketing ROI and campaign performance.
And since the update, marketers have been forced to adopt new ways of tracking and executing efficient campaigns across their social channels.
Most marketers are going beyond the Facebook ad tool and solely using first-party tracking platforms like Google Analytics to track and attribute conversions to Facebook ads.
Related: How to track Facebook ads in Google Analytics
But, like Facebook, Google Analytics can only track conversions and goals.
While it’s useful to know where your leads are coming from and what ads they clicked on, it’s even more useful to know where your revenue is generated.
Using the tools below, we’re able to track leads from our Facebook ads and attribute revenue to understand which marketing tactics contribute the highest converting customers:
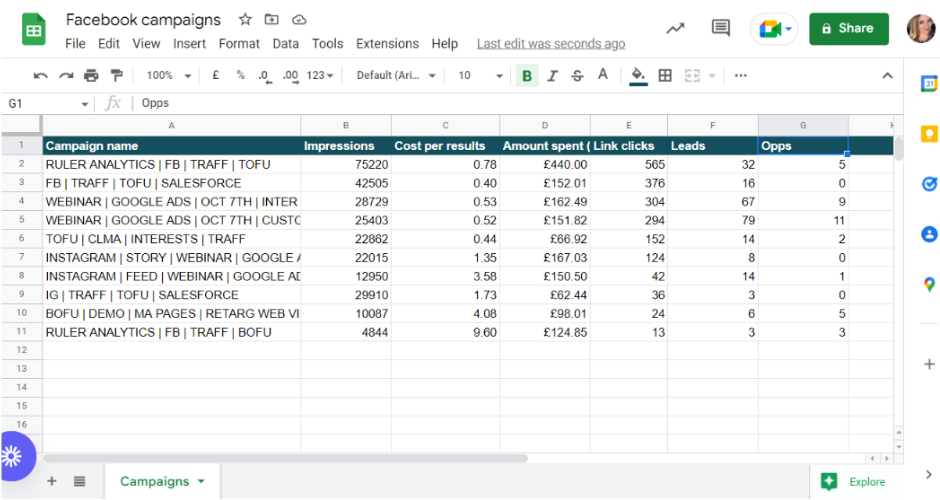
First, we need to export our Facebook ad performance data and display it within our overall reporting document.
This will allow us to track our engagement metrics and match them against our leads, opportunities and revenue data further down the line.
To do this, we head over to Facebook Ads Manager.
We open Facebook Ads Manager > select our time frame and the relevant metrics > click download > select CSV > export.
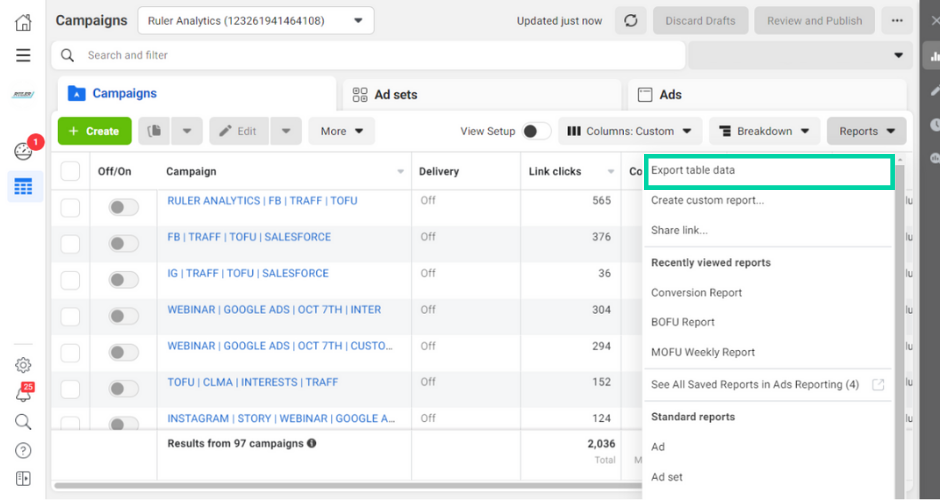
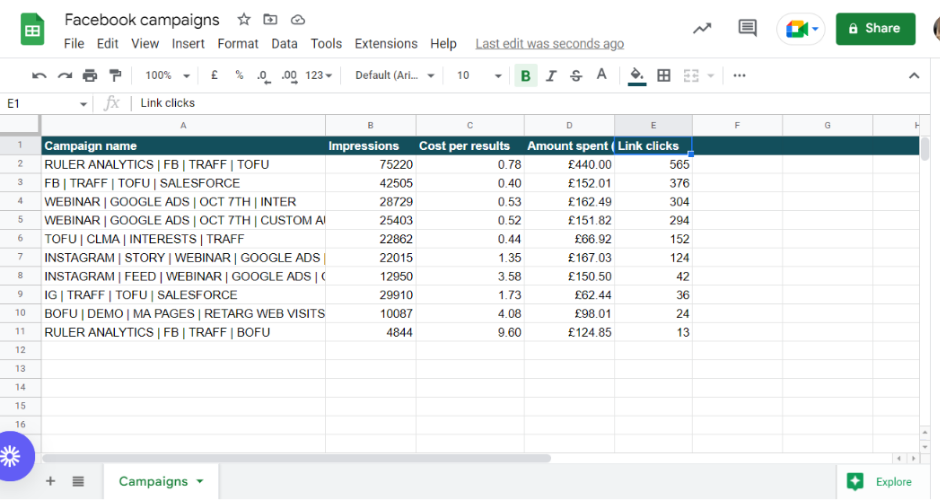
Once exported, we copy and paste this data into our overall reporting document in Google Sheets.
Note: The numbers in this example are fictitious and are only used here as an illustration.
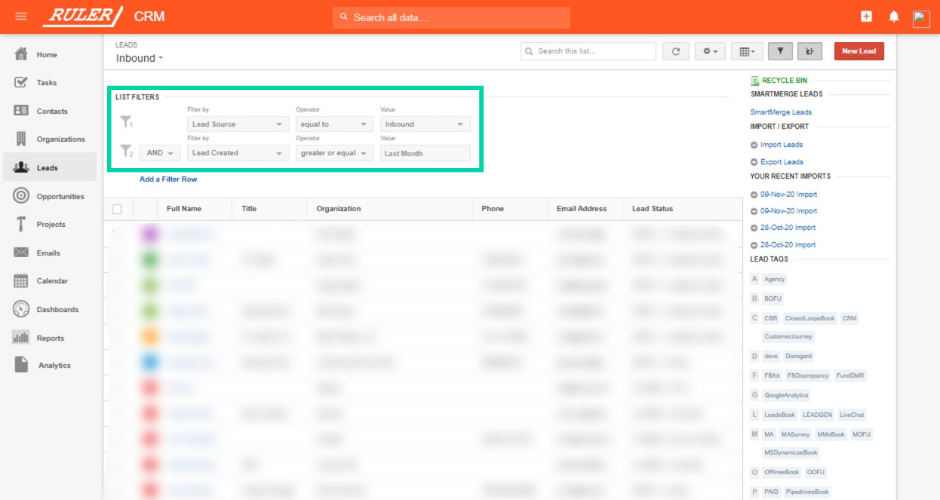
Our next job is to export our leads and opportunities from our CRM.
At Ruler, we use Insightly to store and track our leads and opportunities.
For lead data, we navigate to Leads > Filter leads by last month > export to excel. To export our opportunities, we head over to “Opportunities” and repeat the same steps we followed for leads.
Insightly and other CRMs do a great job tracking your leads and opportunities in the sales cycle, but they don’t provide much insight into where your leads are coming from and how they first connect with your brand.
And it’s for this reason that we use Ruler to gain more insight into where our leads first originated.
Ruler is a marketing attribution tool that tracks each and every web visitor across multiple landing pages and marketing channels and can integrate with almost any CRM.
When a visitor converts into a lead, their contact information is matched with their marketing touchpoints over multiple sessions.
The conversion details and marketing data are then passed onto Insightly.
This allows us to see where our highest quality leads and new customers come from and track how our ad campaigns impact pipeline generation.
For example, below is an example of what a lead looks like in Insightly without Ruler’s data.
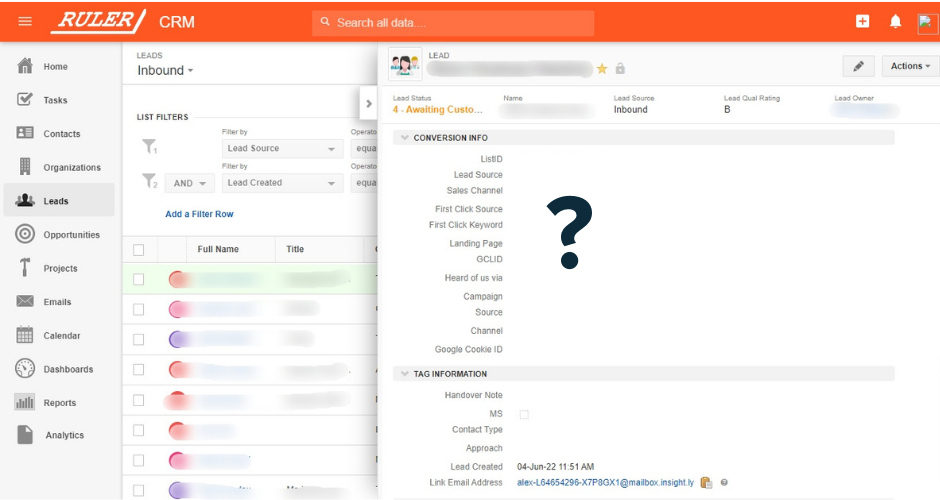
You can see that the necessary contact details such as name, company and email are present.
But, there’s nothing about where the lead originated or what ad campaigns they engaged with before converting.
Now let’s apply Ruler’s attribution data.
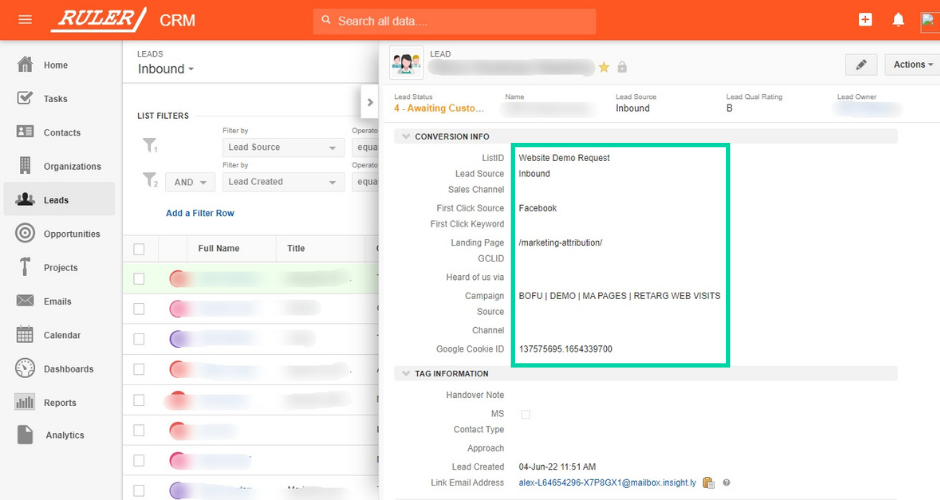
Big difference, right?
With Ruler’s attribution data, we can see that this lead converted after viewing a Facebook ad campaign and converted on our marketing attribution product page.
The data from Ruler allows us to track the effectiveness of our marketing campaigns at every stage of the sales pipeline, allowing us to make better-informed decisions to drive higher-quality opportunities.
If we didn’t have Ruler, the process of tracking the impact of our Facebook ads on opportunities and revenue would be impossible.
Pro Tip
We have plenty more content on how Ruler can help optimise your marketing strategy. But if you want to cut to the chase and see it in action, your best bet is to book a demo and get a more in-depth look at how it works.
Book a demo of Ruler
Now that we’ve exported our data from Insightly, the next job is to match up our leads and opportunities back to the Facebook campaigns that drove the initial interest.
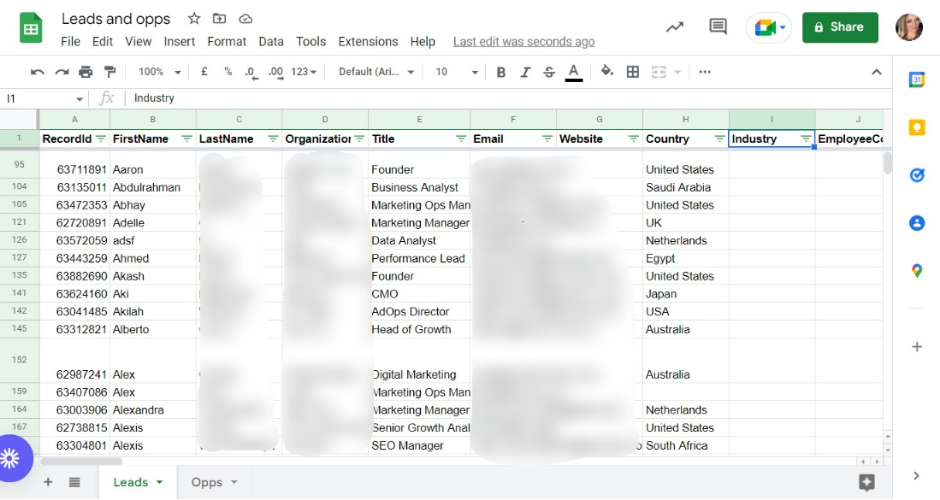
For leads, we highlight all rows and create a pivot table.
For the pivot table, we select Rows > Campaign > Ascending.
Then, we select Values > Campaign > Counta.
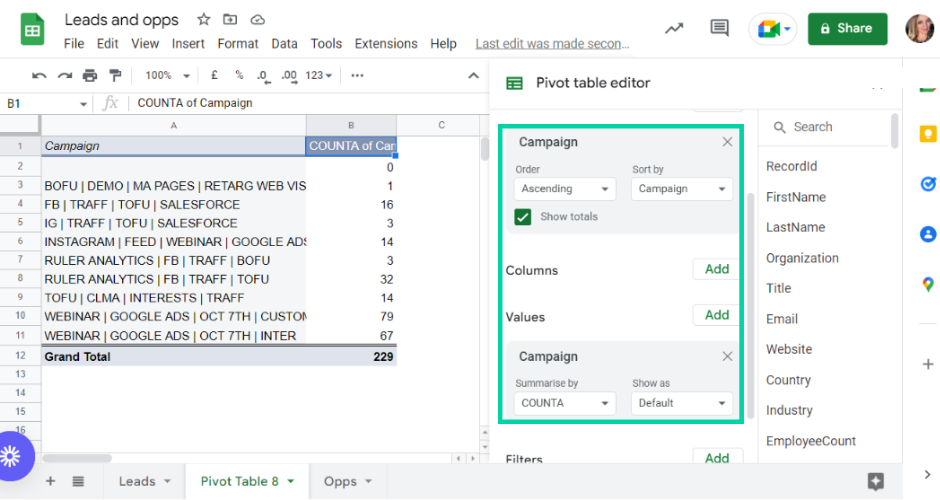
This shows us how many leads each Facebook campaign has added to the pipeline.
We repeat the same process for our opportunities and add the data to our reporting document.
Note: The numbers in this example are fictitious and are only used here as an illustration.
Tracking leads is important for sure, but it shouldn’t be your primary measure of success.
Measuring revenue is essential because it shows how much money the company is making from its marketing operations.
Related: How to track revenue and forecast with Ruler
To find out how much revenue each Facebook campaign has generated, we segment our “Won” opportunities for the month into a new separate sheet. We create a pivot table and follow the same steps: Rows > Campaign > Ascending.
But, once we get to Value, instead of selecting “Campaign“, we choose “BidAmount“.
This shows us how much monthly recurring revenue each campaign has added to the pipeline.
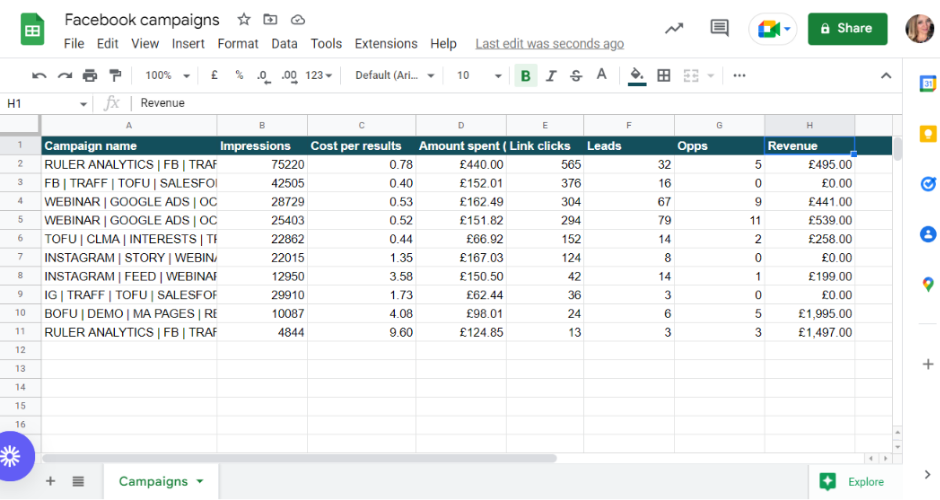
Once we’ve gathered this data, we add it alongside our engagement, lead and opportunity data in Google Sheets.
Now we can see our Facebook campaigns’ exact role in driving leads and revenue for our company.
Note: The numbers in this example are fictitious and are only used here as an illustration.
We also integrate with Chartmogul, our subscription analytics platform, to get a more accurate picture of our lifetime value and churn rates.
Marketers responsible for spending money on Facebook should have a reliable solution in place to track how their ads drive leads and revenue.
Ruler, for example, allows you to filter your performance data and demonstrate how your Facebook ads impact your ROI.
Want to learn more about Ruler? We have plenty more content on how Ruler can help optimise your paid strategy. Or, if you’d prefer to see it in action, book a demo and get a more in-depth look at how it can help improve your reporting.
This article was originally published in 2018 and last updated on 22nd June 2022 for freshness.